


Focus on Recession … or Recovery?
The market turmoil of 2022 couldn’t have been in sharper contrast to the benign conditions of low inflation, easy money and high growth seen in 2021. Persistently high inflation in recent months has led to tighter monetary policy and slower growth.
The Fed has raised rates by more than 400 basis points and reduced its balance sheet by almost $400 billion … with more to come on both fronts. Inflationary pressures have come from both pent-up demand and supply side shocks. The war in Ukraine has lasted longer than most expected and China’s zero-Covid policy further disrupted supply chain logistics.
These factors conspired to push back the peak in inflation and created a hostile environment for risk assets. Investors were left with no place to hide … even bonds did not provide a safe haven in 2022.
Very rarely do both stocks and bonds deliver negative returns in a single year. Over the last almost 100 years, this has only happened twice and 2022 was by far the worst outcome in this regard. Stocks were down almost -20% and bonds were down around -10%.
All of this brings us to an interesting juncture in this bear market. The calls for a recession in 2023 have become virtually universal in recent weeks. The arguments in favor of that view appear well-justified. Growth is clearly slowing, the housing market is falling under the weight of rising rates, the entire yield curve is now inverted, the Fed is far removed from rate cuts and the global economy is in even more dire straits.
These macroeconomic views in turn support the characterization that the current stock market rebound is just another bear market rally. The consensus believes that this rally will only flatter to deceive and stocks are then inevitably headed to new lows. The skeptics further observe that stocks have never bottomed before the onset of a recession and worry specifically about three potentially negative outcomes.
- Services inflation may yet prove to be uncomfortably sticky.
- The Fed may have virtually no flexibility in its policy path forward.
- Earnings, and stock valuations as a result, may continue to slide lower.
We address these concerns specifically in developing our more contrarian and constructive outlook for 2023.
Trends in Components of Inflation
Inflation was clearly the headline story in 2022. But as headline inflation peaks, investors are now switching their focus to economic growth as well.
While the Fed’s preferred inflation gauge is based on Personal Consumption Expenditures, we use the more comprehensive Consumer Price Index (CPI) for ease of discussion here.
Headline CPI inflation peaked at 9.1% in June and has since declined to 6.5% in December. However, core CPI inflation, which excludes the volatile food and energy components, seems to be uncomfortably stuck at an elevated level. Core CPI inflation was 5.7% in December and has been largely unchanged in a narrow band around 6% for several months.
Investors now worry that core inflation will remain stubborn, sticky and elevated for quite a while.
Let’s decompose inflation into its goods and services components and study their underlying trends. Much like the overall U.S. economy, inflation is also more dominated by services than it is by goods.
It turns out that goods inflation has actually declined rapidly in recent months. Supply chain pressures have eased significantly, gasoline prices have fallen sharply and the price of almost all commodities from wheat to lumber has declined dramatically. Unfortunately, since goods are a smaller component of inflation, they have played a smaller role in bringing inflation down.
Services inflation is made up mainly of two components – rents and wages. Both are notorious for being sticky. We look at each of them separately.
The dark blue line in Figure 1 shows CPI shelter inflation, which has been rising steadily for several months and now stands at 7.5%.
![]()

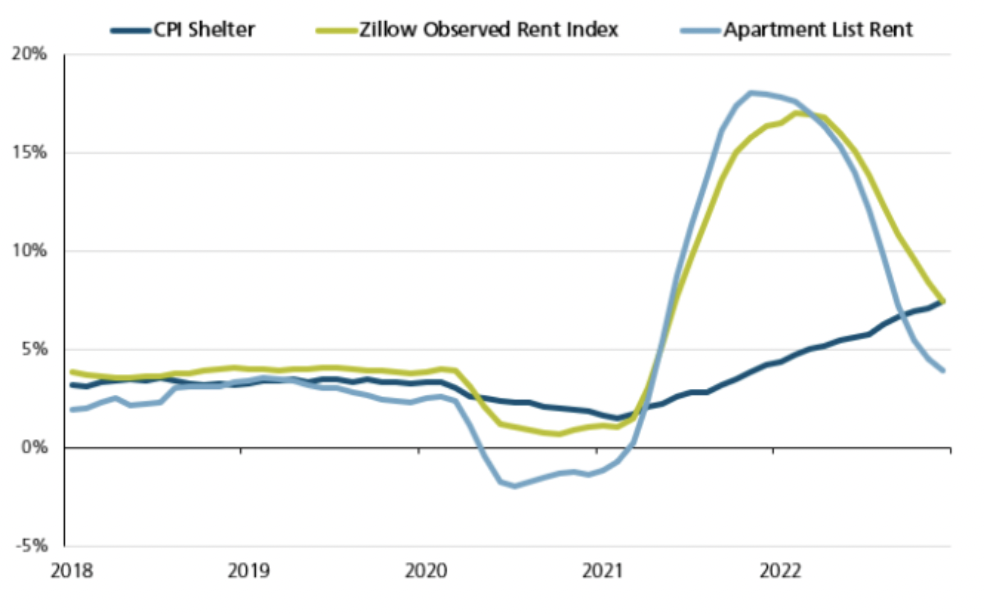

Source: Federal Reserve, Zillow, Apartment List
At first glance, this increase in shelter inflation contradicts the growing weakness in the housing market. But the counter-trend is actually not much of a surprise at all.
Rents are typically negotiated over a 12-month lease. It, therefore, takes 12 months for the entire stock of leases to get re-priced. Even as rents on new leases begin to come down, older leases at previously higher rents slow down the measured decline in rents. This lagged measurement effect does not capture real-time fundamentals because of the delayed discovery of new rent prices.
The good news in Figure 1 is that rents on new leases are indeed coming down. We can see that clearly in the two downward parabolas. Both these lines show rents for new listings and offer a more timely indicator of rent inflation. Rent growth on new leases is declining rapidly. The Dallas Fed projects that rent inflation will likely peak in the second quarter, which means that rent relief is in sight.
Let’s see if wage inflation is also likely to abate by using average hourly earnings as our proxy for wages. The year-over-year change in average hourly earnings was 4.7% in December. This is clearly too high to achieve the Fed’s target of 2% inflation overall.
But again, recent data brings some good news. Wage inflation peaked over a year ago and has since been declining. At its peak, wage inflation was above 6%. In contrast, the annualized pace of wage gains in the fourth quarter of 2022 was less than 4%.
We believe wage inflation will continue to trend lower as the job market begins to cool off. But how far can wage inflation decline? Can it go back to pre-pandemic levels?
Unfortunately, we believe the answer is No, not quite. We believe two reasons may drive a secular uptick in wages – one related to demographics and the other to the pandemic.
As we know, the labor force participation rate is the proportion of the working-age population that is either working or actively looking for work. It represents the available resources for the production of goods and services. An aging population has been a major driver of labor shortages in recent years. As the baby boomers age, the labor force participation rate has been declining for the last 20 years.
We show this demographic trend in Figure 2.
![]()

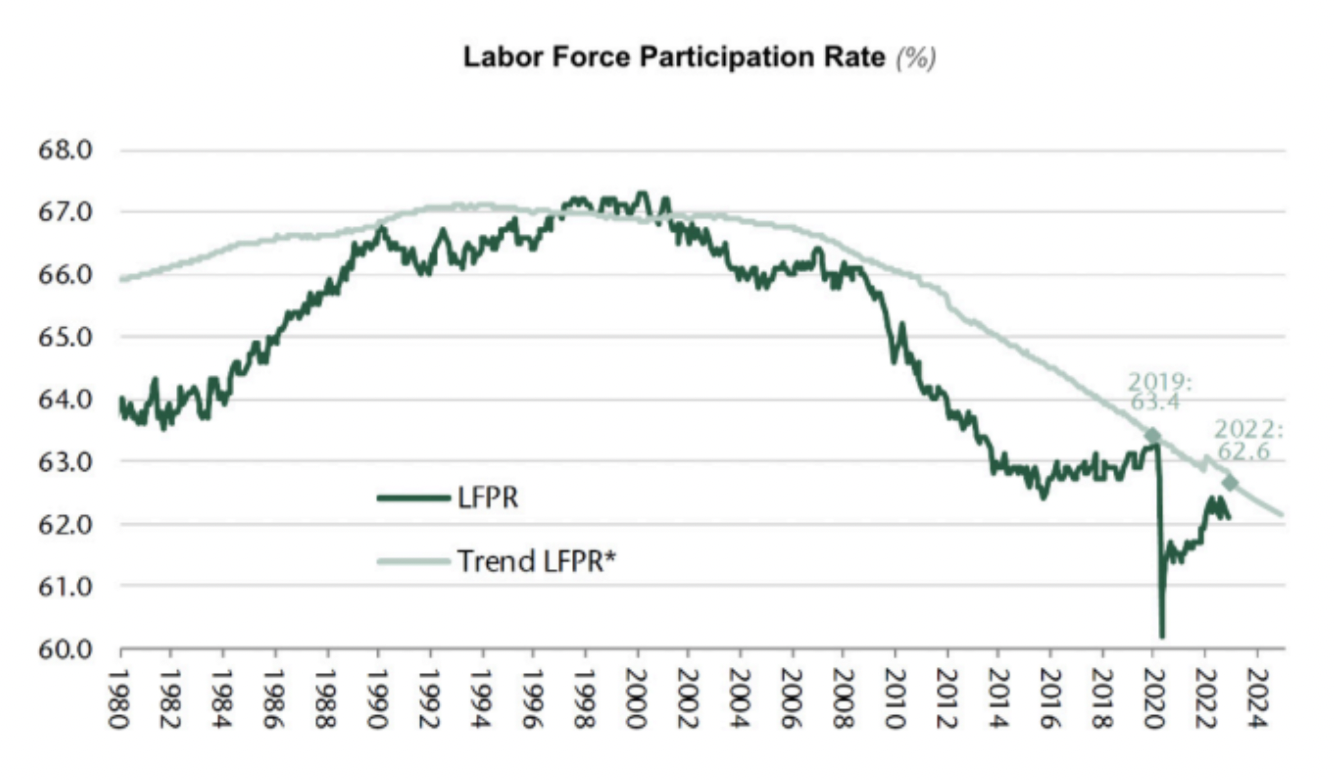

Source: Haver, Jeffries Economics
The labor force participation rate is shown as the dark green line and its trendline is in light green.
The steadily declining labor force participation rate trendline will continue to constrain labor resources. As a result, even as wage inflation comes down, it is unlikely to subside to pre-pandemic levels.
And beyond demographics, there is another factor at play here related to the pandemic.
It turns out that we have more than 2 million fewer workers today than we did prior to Covid. Interestingly, the largest cohort of these missing workers, almost 1 million of them, is in the age group of 65 and above. We can only surmise that these workers embraced full retirement over the vagaries of a Covid-ravaged workplace. They are unlikely to re-enter the labor force.
This pandemic effect is incrementally additive to the broad demographic trend. Absent any major policy reform on immigration, we believe that both wages and overall inflation will eventually settle in at a slightly higher level in the next cycle.
Inflation averaged about 3% between the 1970s and the Global Financial Crisis (GFC). We believe that the abnormally low 2% post-GFC inflation was enabled by a long deleveraging cycle and is unrealistic in this post-covid recovery.
We believe inflation will be less sticky than feared and will continue to decline in coming months. However, we feel it will eventually settle in above the Fed’s target of 2% … somewhere in the 2.5% to 3% range. We also believe that this slightly higher range of inflation will still be benign to stock and bond valuations.
Flexibility of The Fed
The U.S. job market was remarkably strong in 2022 and, as a result, the U.S. consumer was remarkably resilient. However, cracks are beginning to emerge in both the labor market and the overall economy. Layoffs and job losses are mounting, retail sales are falling and economic activity as measured by the Purchasing Managers Index and Leading Economic Indicators is beginning to drop off materially.
The growing evidence of a slowing economy and cooling inflation gives the Fed more flexibility on policy.
As of mid-January, the Fed expects 3 more rate hikes of 25 bps each for a terminal Fed funds rate of 5.1%. It then expects to hold rates steady for the rest of the year. The market, on the other hand, expects only 2 more rate hikes, not 3.
And more importantly, it expects 2 rate cuts in November and December.
Should the Fed pause and pivot sooner than they anticipate? The market believes they should … and so do we.
To the extent that this upcoming recession will be induced by Fed tightening, we believe that the Fed will also have the flexibility to mitigate it before it becomes entrenched.
2023 will offer up a set of binary outcomes. In one scenario, growth slows all the way into a recession. In this setting, inflation comes down and the Fed no longer needs to be restrictive because the inflation war has been won. If inflation instead doesn’t subside, it will likely be on the heels of a fairly strong economy in which case a recession becomes moot.
We, therefore, believe that any potential recession will be short and shallow.
We assign a low probability to the two scenarios that work against our view – high inflation in the midst of a recession or a Fed mistake wherein they remain restrictive for several months into a recession.
Earnings and Stock Valuations
Earnings estimates for 2023 have been declining steadily in the last few months. Despite this downtrend, earnings in 2023 are still projected to grow modestly. Investors worry that these earnings projections are unrealistically high.
Many fear that earnings may fall by levels that have historically been seen during prior recessions. In the four recessionary years of this century (2001, 2008, 2009 and 2020), earnings fell by an average of -15%. A similar decline in 2023 could push stocks to significant new lows.
We offer two counter perspectives.
We agree with the view that earnings are at risk and are more likely to decline from here. But we don’t expect any impending recession to be similar to the GFC or the Covid recessions in terms of its impact on earnings. We believe the upcoming “earnings recession” will also be short and shallow.
Our second observation should further allay concerns about negative earnings growth in general. Conventional wisdom suggests that price generally follows earnings. If earnings go up, price goes up; if earnings go down, price goes down.
But, counter to intuition and popular belief, it is actually possible for stocks to go up when earnings go down! Indeed, they do so more often than not.
We show this interesting anomaly in Figure 3.
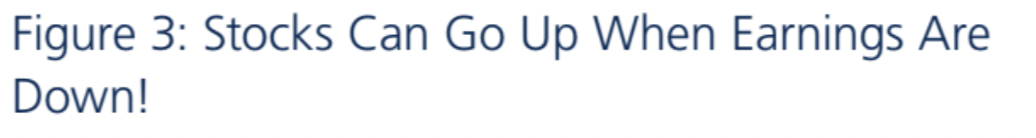


Source: Bloomberg, Evercore ISI Research
We show S&P 500 returns on the y-axis and earnings growth on the x-axis.
There have been 13 instances in the last 50 years when earnings have declined in a calendar year. Stocks were down in only 3 of those 13 years. These limited instances, which include 2008 and 2001, can be seen in the bottom left quadrant of negative earnings, negative returns.
However, in defiance of convention and heuristics, stocks actually go up about 70% of the time when earnings are down. We see that in the top left quadrant of negative earnings, positive returns.
On further reflection, this stock market outcome is not all that surprising. We know that the core function of the stock market is to anticipate and discount future events. It is always looking ahead and often by almost a year.
At pivot points in the economy when a recession might transition to a recovery, stocks can become disconnected from the current reality of weakness and get connected to a new future reality of strength.
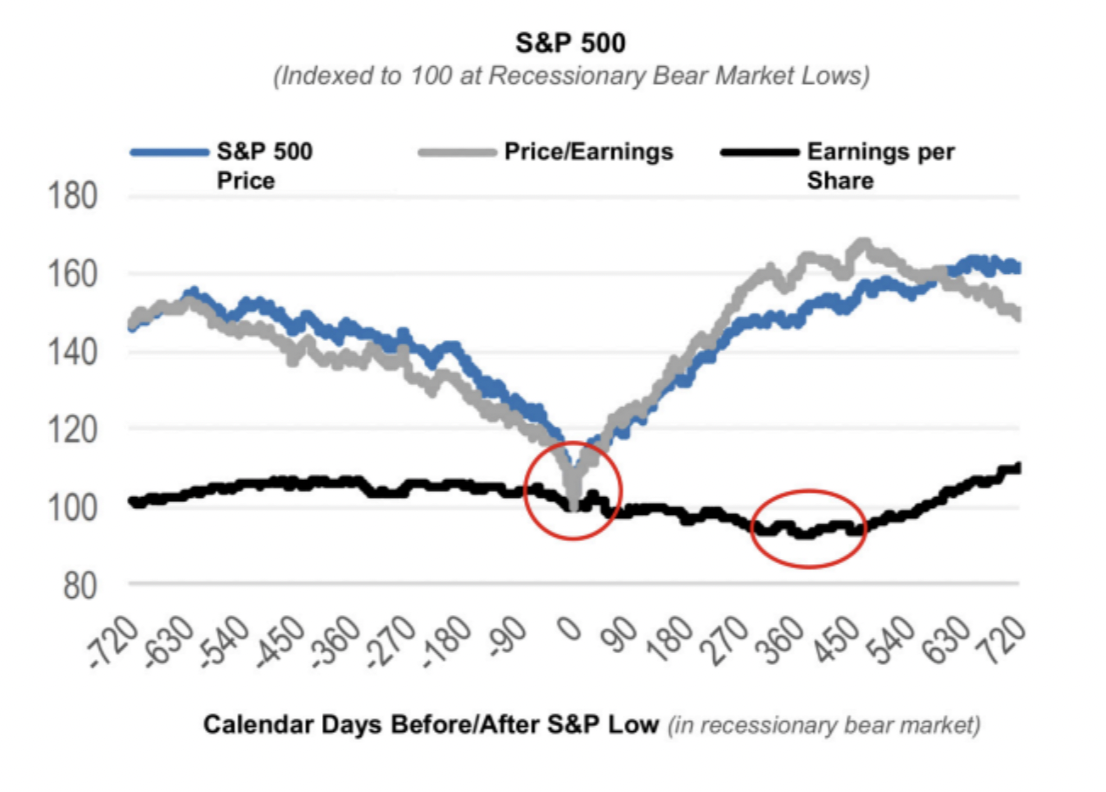
We demonstrate this discounting mechanism both visually and empirically in Figure 4.
![]()


Source: Bloomberg, Evercore ISI Research
Figure 4 plots three S&P 500 variables – prices, price-to-earnings multiples and aggregate earnings. It traces the trajectory for Price (P), Price/Earnings (PE) and Earnings (E) during recessionary bear markets.
Time t = 0 coincides with the low point of the bear market seen during a recession. P, PE and E are all indexed to 100 at t = 0. All data points to the left of t = 0 are prior to the market bottom. All observations to the right of t = 0 are after the market has bottomed out.
In this framework, the trajectory for P is hardly surprising. Prices decline before they hit bottom and then rise thereafter. This V-shape trajectory for P is merely a truism. Stock valuations or PE follow a similar trajectory. The trough in P and PE is marked by a red circle.
Now here is the interesting observation from Figure 4. The solid black line traces the trajectory for Earnings (E) during a recession. As expected, earnings decline as the recession unfolds. E eventually bottoms out as marked by the red oval, but it does so well after P and PE have bottomed out.
So here is the answer to the seemingly confounding earnings conundrum. The trough in prices and P/E multiples leads the trough in earnings. Stock prices anticipate the eventual low point of earnings well before it happens.
How far in advance do stocks bottom out before earnings do? The readings on the x-axis suggest that this lead time can be around a year or so.
If the earnings recession of 2023 ends up being short and shallow as we expect, it is conceivable that the October 2022 low in S&P 500 price and P/E multiple was in anticipation of trough earnings in 2023.
If that were the case, then we could be in the zone between the red circle and red oval in Figure 4 where stock prices and valuations go up even as earnings go down.
We assign a lower probability to a deep economic or earnings recession than the consensus. We believe the market may well have priced any remaining economic or earnings weakness for 2023 through its discounting mechanism.
Summary
Bear markets, especially ones that are accompanied by a recession, can be long, painful and a true litmus test of patience and endurance. So here is our economic and market outlook for 2023 and beyond to help investors navigate the second year of this difficult bear market. We believe:
- Services inflation will be less sticky than feared and gradually abate
- Rent inflation will decline in the coming months as lagged effects roll over
- Wage inflation will subside but not all the way down to its pre-Covid levels
- Overall inflation will likely normalize at 2.5% – 3.0% in 18 to 24 months
- A slowing economy and cooling inflation will give the Fed more flexibility than it anticipates
- Greater Fed flexibility will prevent any potential recession from becoming deep and protracted
- The earnings recession will also be short and shallow, in line with a potential economic recession
- Stock prices and price/earnings multiples may have bottomed ahead of the trough in earnings
- Stocks may be impervious to further declines in earnings
- Stocks and bonds will deliver a decent equity risk premium and term premium
- Bonds will provide better diversification than they have in the past
In the midst of high uncertainty, we remain vigilant but also cautiously optimistic. We continue to emphasize portfolio diversification, risk management and high quality investments.
Download PDF
Services inflation may be less sticky than feared and gradually abate.
A slowing economy and cooling inflation may give the Fed more flexibility than it anticipates.
Stock prices and price/earnings multiples generally bottom well ahead of the trough in earnings.
From Investments to Family Office to Trustee Services and more, we are your single-source solution.
Contact Us
