


The End of Easy Money
Introduction
The market turmoil in 2022 so far is in sharp contrast to the heady mix of stimulative policy and low volatility in 2021. In 2022, persistently high inflation has led to tighter monetary policy and slower growth.
The Fed has raised rates from 0 to 2.25%. It is on track to reduce its balance sheet … perhaps by as much as $500 billion by December. Long term interest rates have moved dramatically in response to inflation and proposed Fed policy. Along the way, the war in Ukraine and lockdowns in China have further pushed back the potential peak in inflation.
These events have conspired to create a hostile market environment for risky assets. At their low point, stocks were down by more than -20% and bonds had declined by over -10%.
As a long cycle of easy money draws to an end, we discuss several implications of a more normalized regime of inflation, interest rates and valuations.
In the short term …
- Have we just seen that elusive peak in inflation or will the data “flatter to deceive”?
- How far behind is the Fed in its tightening cycle and how far does it need to go from here?
- Are we in a recession now? If not, when will it arrive and how long will it last?
- How severe and protracted will the bear market be for stocks and other risky assets?
There are even more intriguing questions on the other side of this economic slowdown.
In the longer run …
- Where will inflation and interest rates eventually settle?
- What will stock and bond returns look like?
These are extraordinary times of change, challenge and chaos. We hope these insights help our readers navigate this unusually high market volatility.
Inflation and The Fed
We know inflation has been rising steadily. It is now remarkably high, pervasive and ubiquitous. However, there are clear signs in recent weeks that inflation may have peaked in June.
Headline and core CPI inflation (Consumer Price Index) for July came in below the June highs and also below consensus expectations. The downside surprise to July inflation has now raised hopes that inflation may have started its descent from June’s lofty 9.1% perch.
It is still feared that wage inflation, which tends to be more sticky and stubborn, will be a key impediment to a swift reversal in inflation. For example, average hourly earnings grew by 5.2% in July on a year-over-year basis.
But a closer look at monthly changes in average hourly earnings others some hints of deceleration. In the last 6 months, average hourly earnings have increased at a slower pace of just around 4%. In contrast, wage gains in the prior twelve months were in the range of 5-6%.
A potential diminution in wage pressures is corroborated with a decline of over a million job openings in recent months and an increase in corporate layoffs.
As inflation and stagflation fears have given way to recession concerns in recent weeks, we have seen other compelling signs of disinflation and demand destruction.
- Longer-term inflation expectations have come down dramatically. As an example, 5-year inflation expectations have fallen from a high of about 3.7% to around 2.6%.
- Gasoline futures are off their highs by over 20%. And the average price of gas at the pump has declined steadily by over $1/gallon since mid-June.
- The price of most commodities including copper, nickel, lumber, wheat and corn has also declined by more than 20% in recent weeks.
- Supply chain pressures continue to decline even as demand seems to be getting weaker.
And finally, at the risk of re-igniting a controversial debate, our last argument in favor of subsiding future inflation comes from monetary theory instead of empirical evidence.
We have previously observed that the relationship between money supply growth and inflation seemed to have broken down after the 1980s. This was borne out by the data between 1990 and 2020.
We believe that this relationship was meaningfully restored over the last couple of years. The recent surge in money supply had a bigger impact on inflation than in prior years because of its sheer size and origin. The colossal $10 trillion of monetary and fiscal stimulus was unprecedented in magnitude. And stimulus checks literally took the form of inflationary “helicopter” money.
As a result, we have seen a revival of Milton Friedman’s well-known thesis that inflation is always and everywhere a monetary phenomenon. As goes money supply, so goes inflation. We believe this played out in a material way in 2021 and 2022. We also acknowledge that the pandemic effects of supply chain disruptions and pent-up demand further exacerbated inflationary pressures.
We show year-over-year changes in money supply and inflation in Figure 1.
Figure 1: Money Supply Growth and Inflation
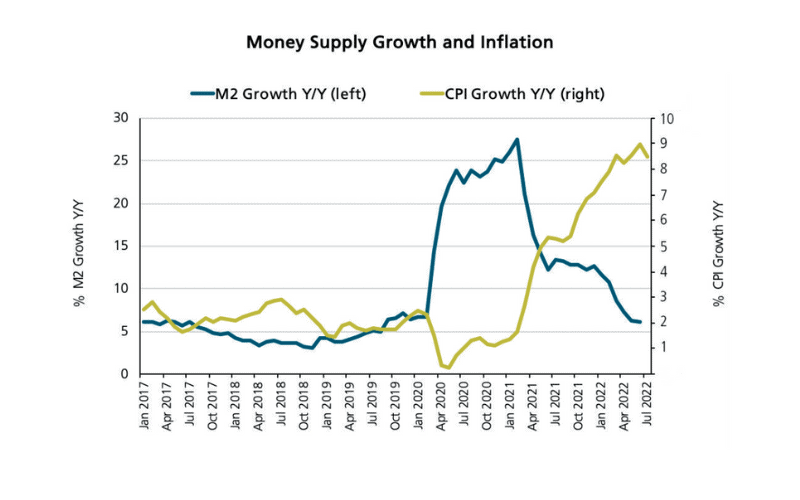

Source: St. Louis Federal Reserve
Our measure of money supply is M2 which typically includes checking, savings and money market accounts. It is shown above in blue. The green line shows the year-over-year change in CPI inflation.
We see two effects playing out in this relationship. One, fiscal stimulus tends to have a bigger impact on inflation than monetary stimulus. And two, monetary stimulus generally works on a lagged basis … typically after 6 to 12 months.
Money supply shot up and peaked at over 25% in early 2021. We believe it contributed to the spike in inflation a year later.
But from that peak, money supply growth has declined dramatically in the last year or so. There are no more stimulus checks and the Fed is now tightening.
We believe that the recent decline in money supply growth has not yet fully impacted inflation. On the same lagged basis, it will likely reduce inflation in the coming months.
We close with a final word of caution on the outlook for inflation. We do not expect inflation to abate nearly as quickly as the rate at which it shot up.
The ongoing war in Ukraine will continue to dislocate commodity prices and supply chains. And even as energy and goods inflation tails off, services inflation which includes rents and wages will likely be stickier and more persistent.
As a result, while inflation will likely recede, it will do so slowly and remain above target in 2022 and 2023. We expect core PCE inflation (Personal Consumption Expenditures) at around 4% by the end of 2022 and at about 3% by the end of 2023.
So, where does all this leave the Fed? And what do they need to do next?
The misguided belief on the Fed’s part last year that inflation would be transient leaves it in a difficult spot in 2022 – fight inflation and risk a recession or avoid a recession and risk a long inflationary spiral.
Its dilemma is further compounded at this point. The Fed finds itself at peak hawkishness with consecutive 75 basis point hikes even as inflation may be peaking.
We begin our discussion on the Fed with a quick recap of their policy responses so far. Yes, the Fed was hopelessly late in beginning its tightening cycle. But we believe they are not as far behind as the current gap between a Fed funds rate of 2.25% and July’s headline CPI print of 8.5% may suggest.
While the Fed was late to raise rates, they did use their policy tool of forward guidance to good effect in engineering a slowdown.
The Fed has clearly communicated in recent months what they expect to do in the future. As a result, financial conditions have already tightened in the form of higher interest rates, a stronger dollar and lower stock prices.
We also anticipate a lower cap to the Fed funds rate than many may fear. We believe that today’s high inflation is not simply a demand problem, it is also a supply issue. In so far as this may be true, the Fed will get some help in the fight against inflation … and it will come from the private sector as supply chains continue to get restored.
So, should the Fed continue on its policy path or consider a pause or a pivot if inflation does peak?
The 2y-10y portion of the yield curve is already steeply inverted. At its current projected pace, the Fed will invert the short end of the yield curve as well by November.
Does the Fed have any options but to invert the entire yield curve before the end of the year?
Maybe.
The Fed’s hawkish stance has so far succeeded in preventing current inflation from becoming anchored in inflation expectations. To keep inflation expectations muted and avoid an inflationary spiral, the Fed needs to continue hiking in the foreseeable future.
But at some point in the next several months, the Fed may have some flexibility. By then, it may be able to look back at a clearly visible peak in inflation. If June proves to be that peak, the Fed may then have enough evidence of falling inflation to consider a shift in policy.
We believe a pivot to rate cuts anytime soon would be a mistake; it runs the risk of prolonging the inflationary cycle much like it did in the 1970s. We believe, however, that a “no-promises” pause in 4 to 6 months may not be as unlikely as many believe… especially if the incoming data shows a clear and convincing trend of disinflation.
We focus next on the depth and duration of a potential recession and the current bear market.
Recession and Bear Market
Investors have agonized about a long list of concerns for several months now. There is one common theme across all these sources of anxiety. Just how severe will this current bear market or a potential recession be?
We look at several factors to answer this question and conclude that the worst fears on this front may be unfounded.
We first assess the impact of higher interest rates on the broad economy. And we do so through two potential transmission mechanisms – its impact on the housing market and corporate profits.
We have addressed concerns about the housing market in our prior writings. It is true that higher mortgage rates have combined with high home prices to push mortgage costs to their highest level since 2008.
But we still refute concerns of a dire housing situation or parallels to the 2008 Financial Crisis for a number of fundamental reasons. These include a limited supply and inventory of homes, greater credit-worthiness of borrowers and a significantly lower household debt to income ratio.
We also uncover an interesting and less-understood observation related to interest expenses and corporate profits.
Corporate debt is typically laddered across a wide range of maturities. On this spectrum, variable rate and short-term debt resets almost immediately to higher interest rates; longer-term debt does not. As a result, short-lived exogenous shocks in corporate bond yields simply don’t transmit as quickly or materially to interest expenses.
We saw this phenomenon during the Global Financial Crisis and we are likely to see it this time around as well. With the abundance of easy money until last year, corporations were quick to refinance most of their debt to much longer maturities.
Less than 15% of corporate debt today is in short-term and variable rate debt. More than 30% of corporate debt has a maturity of 10 years or longer. Based on this distribution, overall interest expenses are unlikely to rise sharply any time soon.
We offer one final observation in support of our belief that any potential recession is less likely to be deep and protracted.
The strength of the U.S. economy at the beginning of the year was based on a strong U.S. consumer. The strength of the consumer in large part is derived from the health of the labor market.
Figure 2 shows that the labor market has held up surprisingly well through the turmoil this year. Cumulative job growth has handily outstripped GDP growth in 2022.
Figure 2: Employment and GDP

")
Source: St. Louis Federal Reserve
Figure 2 shows two consecutive quarters of negative real GDP growth which suggests that we may be in a recession right now. However, it is hard to square that up with the health of the labor market. We see in Figure 2 that employment has been strong – more than 3 million new jobs have been created in 2022 through July and the unemployment rate is at 3.5%. In the same period, Gross Domestic Income (GDI) has also been positive and divergent from GDP.
The National Bureau of Economic Research (NBER) determines the beginning and end of recessions using several metrics. GDI and employment are two of the more important factors in their assessment. It will be curious to see if the NBER eventually labels the first half of 2022 as an official recession or not. We wouldn’t be surprised if the answer turns out be No.
We believe that the economy is strong enough where any potential recession, should it unfold, will be short and shallow.
And how about the current bear market in stocks? Could it become more severe and protracted? Is the recent uptick in stock prices the beginning of a new bull market or simply a bear market rally?
The outlook for stocks depends on how resilient corporate earnings turn out to be in the coming months. Earnings have held up remarkably well through the first half of 2022. In the first two quarters, earnings came in well above consensus expectations. 2022 earnings growth for the S&P 500 is still on track to match its 9% estimate from the beginning of the year.
While earnings estimates for 2023 have declined a bit in recent weeks, they also remain surprisingly robust. Earnings for the S&P 500 in 2023 were projected to be around 250 at their high point; they are now estimated to be 2% lower at 245.
It was widely expected that high inflation and a strong dollar in the second quarter would take a bigger toll on corporate profits. Those fears have not yet been realized. In fact, if inflation peaks in June, inflation and currency headwinds will only diminish from this point on.
In order for stocks to retrace their recent gains and create new lows, we estimate that 2023 earnings need to fall by another 10-15% to the 210-220 level. We deem this to be less likely than feared. If the devasting second quarter could dent 2023 earnings by only 2%, then subsequent quarters with weaker head-winds are unlikely to inflict greater damage.
We believe that the underlying strength of the U.S. economy and company fundamentals will allow earnings to withstand adverse inflation and currency effects.
There is still a dominant view in the investment community that the recent rebound in stock prices is simply a bear market rally that will eventually give way to new lows. We assign a greater probability to the counter view that this may be the start of a new bull market.
In summary, we do not expect the current growth scare to degenerate into a prolonged recession or a lengthy bear market.
We also look further out into the next decade and offer the following perspectives on the economy and the markets.
Longer Term Outlook
Here is a brief look at the longer term outlook for inflation, interest rates, and stock and bond returns.
The last five decades have seen 3 distinct inflation regimes. We show them in Figure 3.
Figure 3: CPI Inflation in the Last Five Decades
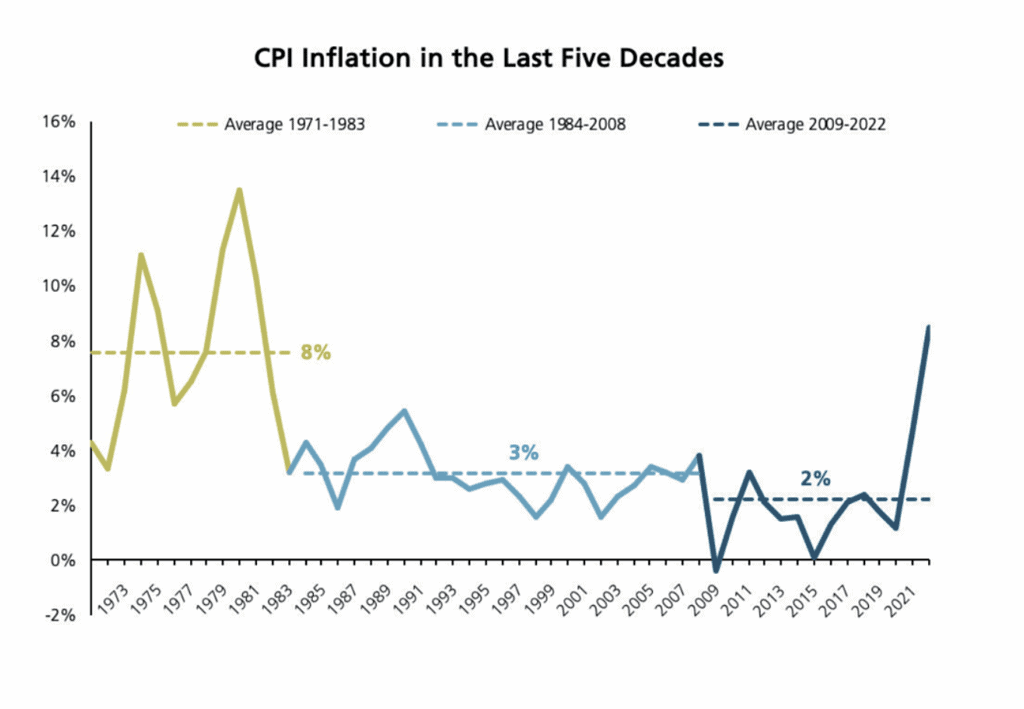

Source: St. Louis Federal Reserve, 2022 – year-over-year change as of July
Figure 3 shows that inflation was about 8% on average during the 1970s. It then declined to around 3% from the 1980s to the Global Financial Crisis (GFC) and fell even lower to around 2% after the GFC. Which of these 3 regimes are we likely to see over the next decade?
We have already argued against a prolonged 1970s type of recessionary spiral. We also believe that the 2% post-GFC inflation represents a cyclical low which may be difficult to reach in the next cycle.
The GFC was a severe financial crisis which then led to an even more pronounced deleveraging cycle in its aftermath. Absent such a strong disinflationary force and in the face of potential de-globalization, we believe inflation in the coming decade is more likely to be around 3% than around 2%.
In this setting, we expect the neutral long-term Fed funds rate to remain around 2.5-3.0%. At these levels, it will keep pace with realized inflation.
The post-GFC and post-Covid periods were characterized by low, and even negative, long term interest rates across the globe. Real interest rates, net of inflation, were significantly more negative.
We believe that this era of easy money is now over and expect interest rates to be higher in the next decade. U.S. Treasury bond yields will likely be in the 3-4% range and, as a result, real long term rates will also be positive.
We believe real GDP will settle in at a more normal level of around 1.5-2% in the next decade. This should still allow earnings to grow in the range of 6-8%.
We next assess what a fair Price/Earnings (P/E) multiple might be for stocks going forward.
We draw on historical precedent in Figure 4 to answer the question.
Figure 4: P/E Multiples by Inflation Regime.


Source: Strategas
Figure 4 shows trailing 12-month P/Es across different inflation regimes. Stocks perform best when inflation is low and between 0 and 4%. At either extreme, both deflation and high inflation tend to destroy profit margins and compress P/E multiples.
Based on the data shown in Figure 4, our expectations of inflation around 3% and our view on interest rates, we believe that the fair P/E multiple for the S&P 500 index in the next cycle is likely to be 18-19 times trailing 12-month earnings.
We expect this economic backdrop will lead to more traditional returns for stocks, bonds and cash. It is likely that cash generates returns in the 2-3% range, bond returns are around 3-5% depending on credit exposure and stock returns are between 7-9%.
Within these ranges, investors can expect normal levels of risk premiums for bearing the risk of investing in stocks and bond over the next decade.
Summary
The sheer breadth and depth of economic uncertainty so far in 2022 has been truly unprecedented. We have rarely, if ever, seen such divergent economic and market forecasts in the past.
In an effort to filter some signals from all the noise, we summarize our key observations at this crucial juncture.
We believe:
- Inflation will moderate from here and recede gradually
- Short and long Treasury rates are less likely to exceed 4%
- Any potential recession, should it unfold, is less likely to be deep and protracted
- The bear market in stocks may well be shorter than most investors expect
- Stocks offer more upside than downside over the intermediate term
We are mindful of the broad range of unknowns at this point and the even greater need to invest with care and prudence. We remain firmly committed to the basic principles of portfolio diversification, risk management and investing in high quality companies.
Download PDF
We do not expect to see a lengthy recession, should it even unfold, nor a prolonged bear market.
We also expect to see a more normalized regime of inflation, interest rates and valuations in the next decade.
From Investments to Family Office to Trustee Services and more, we are your single-source solution.
Contact Us
