
Still Narrow Leadership in a Topsy-Turvy Year
So far in 2026, the U.S. stock market has shown an uncanny resemblance to last year. In both instances, a policy initiative sparked a sharp selloff in stocks, e.g. the global trade war in 2025 and the military conflict with Iran in 2026. The selloff brought the stock market to the brink of a bear market last year and to the cusp of a correction this year. The parallel narratives continued to move in tandem when a subsequent about-turn in the triggering policy unleashed a rapid rebound in stock prices. Again, in both cases, the ensuing rally carried the stock market to double-digit gains for the year.
It has been a year of extreme volatility. Geopolitical fears initially spiked and then abated while the technology and energy sectors produced rollercoaster rides along the way, with some stocks rising to dizzying heights before falling back. The S&P 500 index fell by more than -9% over a few weeks before bottoming out on March 30, 2026; it then rebounded by almost +20% in the next two months. For the first half of 2026, the S&P 500 index gained +10.2%, the Nasdaq index rose by +12.8% and the Russell 2000 index of small companies shot up by +22.0%. Emerging markets also performed exceptionally well.
We trace the topsy-turvy trajectory of the stock market in 2026 to understand how the market was, almost counter-intuitively, able to overcome geopolitical headwinds. We also share our thoughts on the potential paths to greater stability in the coming months.
Geopolitics
We have long observed that geopolitical events generally do not have a material or lasting impact on markets. The Iran conflict has been different mainly because of its Middle East location, which immediately put the supply of oil at risk. This amphitheater of action initially brought about some unsurprising outcomes. Oil transports through the Strait of Hormuz (“the Strait”) came to a virtual standstill, oil prices nearly doubled, inflation rose sharply, bond yields shot up and stock prices tumbled.
In the throes of the conflict and at the peak of the panic, we had maintained that the Iran war was unlikely to drag on for a prolonged period. We were optimistic then that oil prices would decline well below their high of $120 per barrel by mid-year and that inflation and interest rates would follow suit soon thereafter. These expectations have generally materialized e.g. West Texas Intermediate crude oil in the U.S. was trading below $70 per barrel on June 30, 2026.
The fragile cease-fire negotiated in the second quarter has been difficult to preserve. Having discovered its newfound leverage in negotiations by controlling the Strait, Iran is now seeking to monetize that control through tolls on commercial oil tankers. The constant attacks from Iran on shipping traffic in the Strait have led to renewed U.S. military strikes, the re-imposition of a blockade and an almost complete breakdown of the ceasefire. At the time of this writing, U.S. crude oil is trading higher at nearly $80 per barrel.
The big decline in oil prices in June enabled the Consumer Price Index (CPI) to fall as well. Year-over- year headline CPI inflation declined from 4.2% in May to 3.5% in June. Since oil prices affect a variety of goods, even core CPI inflation, which excludes food and energy, fell from 2.8% in May to 2.6% in June. The 10-year bond yield is also lower, below 4.6% from its intra-year high of 4.7%.
We expect progress on the Iran conflict to move in fits and starts. We have de-escalated significantly from the worst case scenario of a protracted and painful war. Even as tensions reignite, we do not expect oil prices to reach previous highs or inflation and interest rates to make new highs.
It will be interesting to see how oil prices adjust from here on. We have already seen discernible demand destruction globally after the oil supply shock in March. If consumer preferences alter meaningfully and permanently as a result and supply eventually gets restored back to almost pre-war levels, we may well see a glut of oil with downward pressure on oil prices.
On the other hand, the constant threat to the Strait from Iran’s malintent and newly discovered leverage may add a quasi-permanent risk premium to oil prices and eventually to global bond yields. However, as productivity growth increases in an AI-dominated world and fosters disinflation, we are hard pressed to see oil above $75 per barrel over the long term.
We move on from the waning topic of geopolitics to the real story of the second quarter which materially moved markets.
Exceptional Earnings Strength
Many investors were taken by surprise and caught flat-footed by the sudden reversal in stock prices from April onwards. The adverse impact of higher oil prices had already started to show up in higher inflation by March. Expectations of any rate cuts by the Fed were quickly dashed as markets began to anticipate rate hikes instead. Inflationary pressures and a potentially hawkish Fed pushed the 10-year Treasury bond yield up from below 4% at the end of February to 4.7% in mid-May. The likely decline in demand from such a backdrop had investors worried about a potential economic slowdown or perhaps even a recession.
The key catalyst that turned things around was an unexpectedly strong earnings report card for the first quarter. Earnings were initially expected to grow at around 13% from a year ago; they eventually came in at a 29% annual growth rate! Companies also provided strong earnings guidance for upcoming quarters during their first quarter earnings announcements.
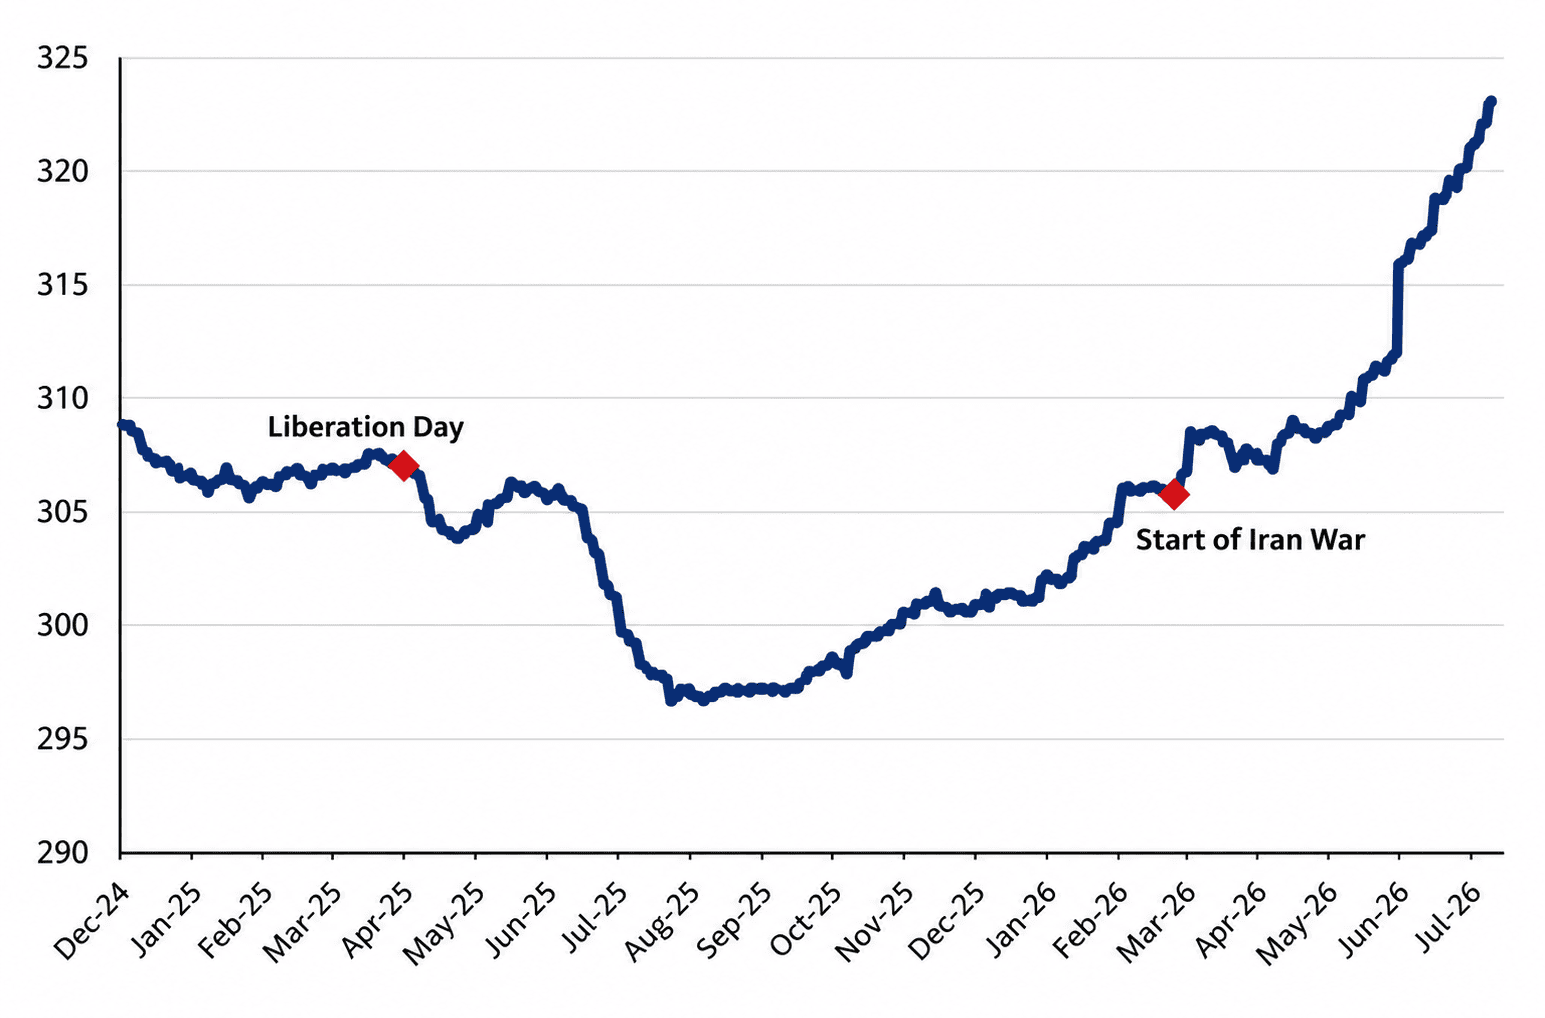
Figure 1 shows how estimates of Next Twelve Months Earnings Per Share (EPS) for the S&P 500 index have changed over time.
Figure 1: S&P 500 Next Twelve Months EPS Estimates
Source: FactSet
In a scarcely believable moment of magical timing, the inflection of future earnings to a sharply higher level coincides remarkably (see red diamond in Figure 1) with the start of the Iran war!
This one picture removes all mystery about how and why the market pivoted so sharply from geopolitical distress to fundamental cheer. Stock prices invariably follow earnings except on rare occasions. As go earnings, so go prices. We can now see that there was nothing confusing or speculative about the market rebound from April onwards. In fact, to add fuel to the fire, the slew of positive earnings surprises was then bolstered by a de-escalation in the Iran conflict.
The good news on the earnings front continues to unfold as expectations for earnings growth get revised higher and higher. We present a few earnings growth metrics as evidence at the time of this writing.
- Second quarter 2026 from ~19% to ~24% over the last 3+ months
- Calendar year 2026 from ~16% to ~24% over the last 6+ months
- Calendar year 2027 from ~15% to ~17% over the last 6+ months
In an interesting side note, we point out that the stock market rally in 2026 has been so clearly driven by earnings that the forward P/E ratio for the S&P 500 index has actually gone down from 22x at the beginning of the year to 20x at midyear.
We observe that most of the abnormal earnings growth has come from just two sectors – primarily from the technology sector on the heels of continued AI investments and secondarily from the energy sector which benefitted from higher oil prices.
At the broad index and market level, the rise in prices seems to be well-supported by growth in earnings. A closer examination reveals some incredible outliers in both price changes and earnings revisions. Some of the underlying outsized returns and earnings outcomes are worth reflecting upon as we develop our future market outlook.
Narrow Leadership in Returns and Earnings
We have seen this theme of narrow leadership play out in the markets before when both returns and earnings come predominantly from a small, select subset of stocks. For the last three years, the Magnificent 7 took on this mantle. Not only did these seven companies generate most of the market’s returns and earnings, but they also became some of the largest companies in the U.S. and the world. At their peak, the Magnificent 7 posed significant concentration risk by becoming almost 40% of the S&P 500 index’s total market value.
Returns
The Magnificent 7 have surrendered their dominance of market returns in 2026. However, the new emerging stock market leadership still remains narrow and limited to a small subset of spectacular performers.
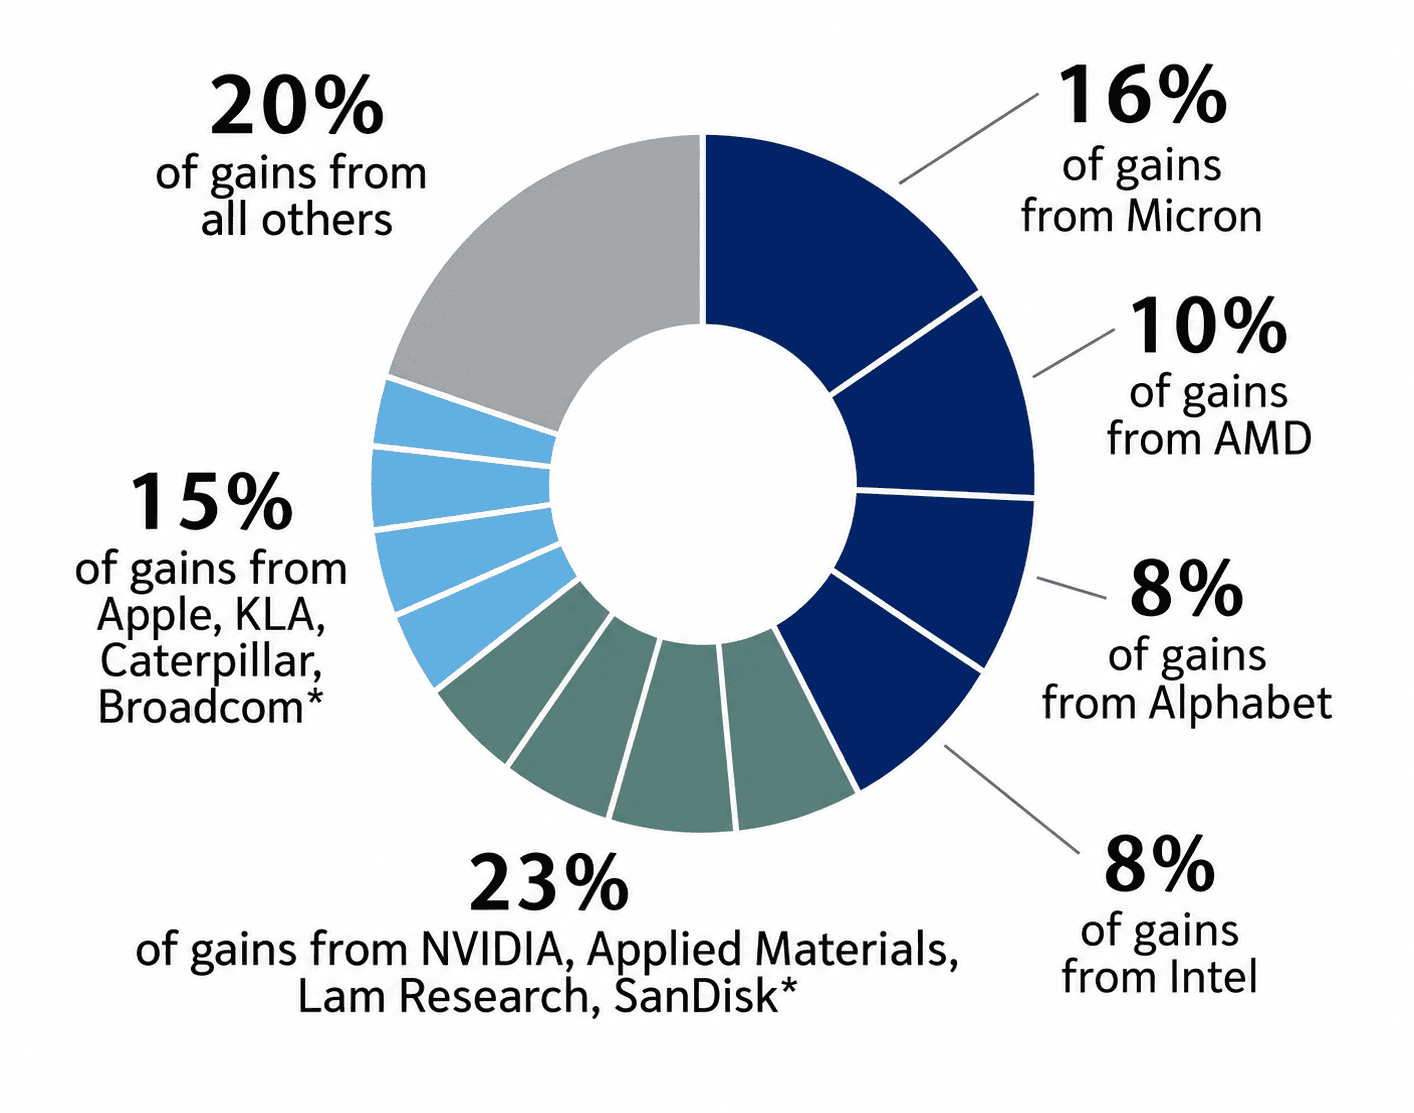
Figure 2 tells a remarkable tale of disproportionately dominant returns from just a handful of stocks.
Figure 2: Top S&P 500 Return Contributors in First Half of 2026
Source: FactSet, RBC
The chart above depicts an incredible story of narrow leadership and dominance of market returns. Here is a breakdown of the S&P 500 index’s 10.2% total return in the first half of 2026.
- The top 4 contributors account for more than 40% of the index return.
- Micron, AMD, Alphabet and Intel
- The top 8 contributors make up 65% of the index return.
- The top 12 contributors, or less than 3% of index constituents, represent 80% of index returns.
- Only 2 of the Magnificent 7 appear in the top 8 contributors to index returns – Alphabet and
Nvidia. - All top 12 contributors are tied to the AI theme.
- AI-driven dominance has now shifted from the hyperscalers to the “brick and mortar, picks and
shovels” plays in semiconductors and memory such as Intel, Applied Materials, Lam Research,
Broadcom, Micron and SanDisk. - The top 4 returns within the index were generated by SanDisk (+858%), Micron (+304%), Intel
(+278%) and Western Digital (+271%); the smaller index weight of some of these stocks kept
them from ranking among the highest contributors.
Even more incredibly and incredulously, the same theme holds in even greater disproportion for global stocks. The top 12 stocks in the MSCI All Country World Index of 2,500 stocks, or less than 0.5% of all constituents, account for almost 50% of the global equity index return! Not surprisingly, the top 4 contributors globally are also semiconductor and memory stocks – Micron, S.K. Hynix, Taiwan Semiconductor and Samsung.
There is a useful takeaway here for portfolio performance; since 80% of index returns came from less than 3% of index constituents, most equity portfolios were at risk of missing these stocks and underperforming their benchmarks as a result.
We established above that price performance in the broad stock market has been fundamentally driven by earnings growth. We find this also holds true for the new and narrow group of performance leaders identified here.
Earnings Growth
As a rule of thumb, price follows earnings; it comes as no surprise that the top return contributors above also produced strong earnings growth. And, just as we saw with returns in the broad market, leadership in earnings growth was also narrow and dominated by a small subset of stocks.
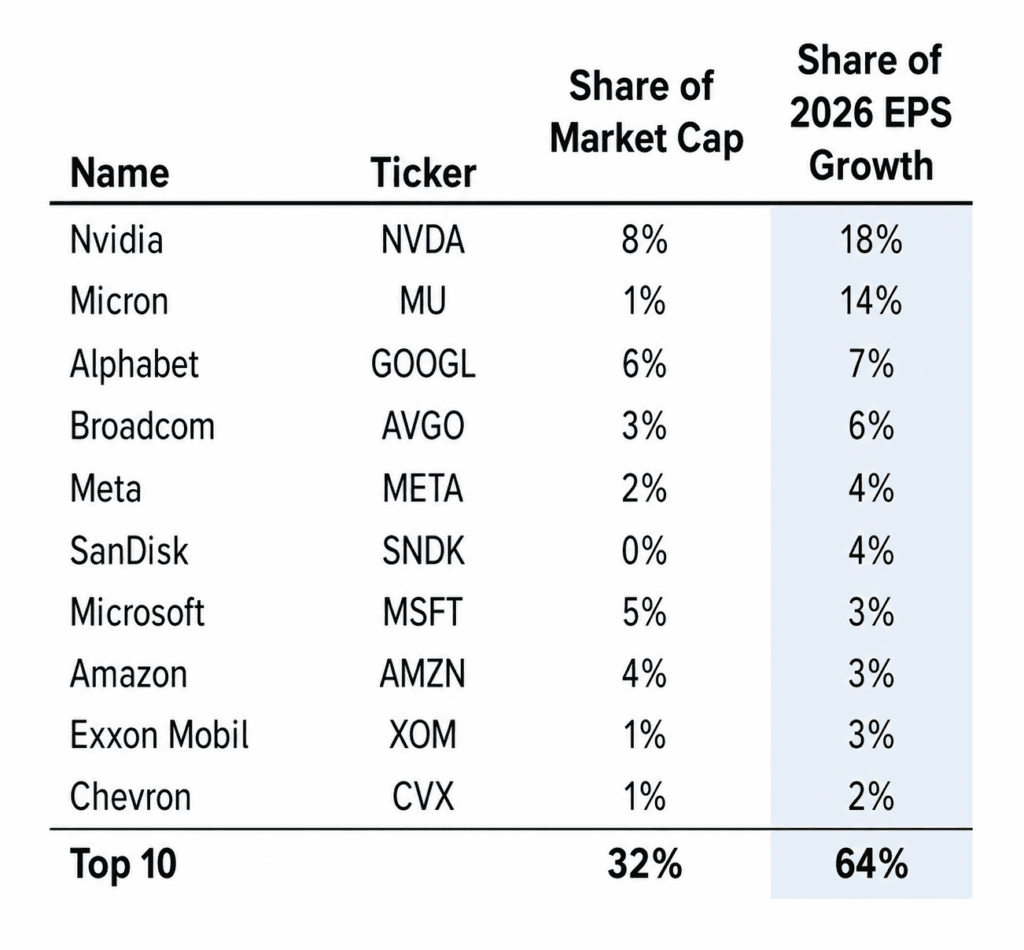
Figure 3 highlights the disproportionate impact of just a handful of stocks on overall S&P 500 earnings growth in 2026.
Figure 3: S&P 500 Earnings Per Share Growth in 2026
Source: FactSet, Goldman Sachs
As before, the mix is remarkably narrow and asymmetrical. The top 10 companies ranked by growth in Earnings Per Share, or a mere 2% of index constituents, account for 64% of the S&P 500 index’s EPS growth in 2026. Here are a few highlights from a breakdown of this composition.
- Not surprisingly, the top 4 contributors to the index EPS growth rate are Nvidia, Micron, Alphabet and Broadcom.
- The top 10 contributors to the index EPS growth rate also include Exxon and Chevron.
- Their EPS growth rate was viewed to be unsustainable and, therefore, was not rewarded with strong returns.
- All 4 major hyperscalers (Microsoft, Amazon, Alphabet and Meta) appear on the list of top EPS growth rates.
- However, only Alphabet makes it to the list of the top 12 return contributors.
This uneven price response to the same stimulus of strong earnings growth highlights some subtle risks for equities at their current valuations. The market may look through a temporary spurt in earnings as it did for Exxon and Chevron in anticipation of lower oil prices ahead. Investors may also be pricing in other future risks as appears to be the case with the hyperscalers; markets have adopted a wait-and-watch approach to see whether their continued AI capex spending will generate a sufficiently high return on investment.
Even for those companies rewarded so far for spectacular earnings growth such as Micron and SanDisk, investors remain uncertain about the forward P/E multiple at which to value these high earnings.
Semiconductor and memory stocks have historically been classic cyclical plays which are vulnerable to boom-and-bust cycles as supply and demand imbalances emerge and then disappear.
While the overall market seems to be well-supported by higher earnings, both the “narrowness” and the cyclical nature of today’s new leaders in returns and earnings warrant a careful continuous assessment of the unfolding AI (r)evolution.
Summary
While it may have felt incongruent and even counter-intuitive for the stock market to reverse so abruptly, it did so for a sound and fundamental reason. Earnings growth in 2026 so far and expectations for the foreseeable future have skyrocketed. Stock prices in turn have simply followed earnings higher.
Our mid-year assessment is summarized in the following key observations.
- We expect progress on the Iran conflict to be slow and disjointed.
- However, we have reliably de-escalated from the worst case scenario of a long, painful war.
- Even as tensions reignite, we do not expect oil prices to reach previous highs or inflation and interest rates to make new highs.
- The stock market reversed abruptly from April onwards for a simple, sound and fundamental reason.
- Earnings growth in 2026 so far and expectations for the foreseeable future have skyrocketed.
- The new emerging stock market leadership still remains extremely narrow and limited to a small subset of spectacular performers.
- The top 12 contributors, or less than 3% of 500 index constituents, account for 80% of the S&P 500 index total return.
- The top 12 contributors, or less than 0.5% of 2,500 index constituents, account for 50% of the global MSCI All Country World Index total return.
- Semiconductor and memory stocks have delivered spectacular earnings growth and price performance.
- They have also historically been classic cyclical plays which are vulnerable to boom-and-bust cycles as supply and demand imbalances ebb and flow.
- The “narrowness” and the cyclical nature of today’s new leaders in returns and earnings warrant a careful ongoing assessment of global equity markets.
Global stock markets appear to be well-supported so far by significantly higher earnings growth rates. However, the narrow and cyclical nature of the new market leadership may create some unexpected portfolio risk exposures. We remain constructive on the economy and markets, but are even more vigilant than normal in monitoring unusual volatility within cyclical sectors.