Chaos in Commodities
After 2025 was jolted by a global trade war and a U.S. government shutdown, investors had hoped for greater stability and lower volatility in 2026. However, the first quarter of 2026 has been far from tranquil as geopolitical events have dominated headlines. A surprising common denominator emerges across these events; they all revolve around access and flow of materials and commodities.
The discussion on Greenland has been at least partly motivated by its vast, but currently inaccessible, reserves of rare earth minerals while military action in Venezuela and Iran is partly aimed at curbing their illegal flow of sanctioned oil to other hostile regimes around the world.
The U.S. removed then-Venezuelan President Nicolas Maduro from power on January 3, 2026. The action disrupted Venezuelan oil exports to China and increased U.S. control and potential access to Venezuela’s vast oil reserves. While its oil is heavier and contains more sulfur, Venezuela nonetheless boasts oil reserves of around 300 billion barrels, which is more than those of Saudi Arabia.
The joint U.S.-Israel military strikes against Iran began on February 28, 2026. Tensions over Iran’s burgeoning nuclear program have escalated in recent years, along with concerns over its growing regional influence through hostile proxies. After economic sanctions and negotiations failed to curb Iran’s ambitions on either front, the U.S. resorted to active conflict in the hope of achieving a more permanent resolution through regime change or a downshift in radical ideology.
Under most circumstances, geopolitical events make for interesting drama and theater but rarely have a lasting impact on the economy and the markets. However, recent events warrant a deeper consideration at two levels. First, war inevitably results in the loss of innocent lives as part of its collateral damage; it is understandable to mourn the human tragedy of war.
Second, with the military action centered right in the nexus of the Middle East, a reduced supply of oil has become a key risk to global economies and markets. Oil prices have risen sharply from levels seen in February; investors now worry that a prolonged supply disruption could threaten global economic growth and risk a global recession.
Even as we focus on the turmoil in the oil markets, we are also intrigued by the unusual price action in another commodity. Gold has long enjoyed the unique status of a safe haven asset during periods of extreme uncertainty. It is also recognized as a reliable hedge against inflation. The inflationary and recessionary implications of surging oil prices presented the perfect backdrop for gold to shine as a beacon of security and protection. However, gold sold off sharply during this period, like any other risk asset, running contrary to its safe haven status.
In this article, we examine the scope and impact of the energy crisis on global markets and also offer insights into the traditional role of gold within portfolios for hedging purposes. We recognize the rapid pace at which events are unfolding and date these remarks as of the failed peace negotiations in Islamabad and the ensuing U.S. naval blockade.
Friction in Oil Markets
The U.S.-Israel military initiative has targeted Iran’s regime leadership and the industrial base that supports its nuclear aspirations and hostile regional proxies. In retaliation, Iran has assumed control of the Strait of Hormuz (“the Strait”) and reduced the almost 20 million barrels per day (mbpd) of oil transports to a near standstill, creating a virtual chokepoint for global oil markets. Iran has also refused to terminate its nuclear weapons enrichment program.
There have been a handful of major crises in the last 70 years that saw significant disruptions in oil supply. However, none of them come close to the current crisis in terms of the sheer magnitude of the supply disruption. We highlight these episodes in Table 1 below.
Table 1: Comparison of Oil Supply Disruptions
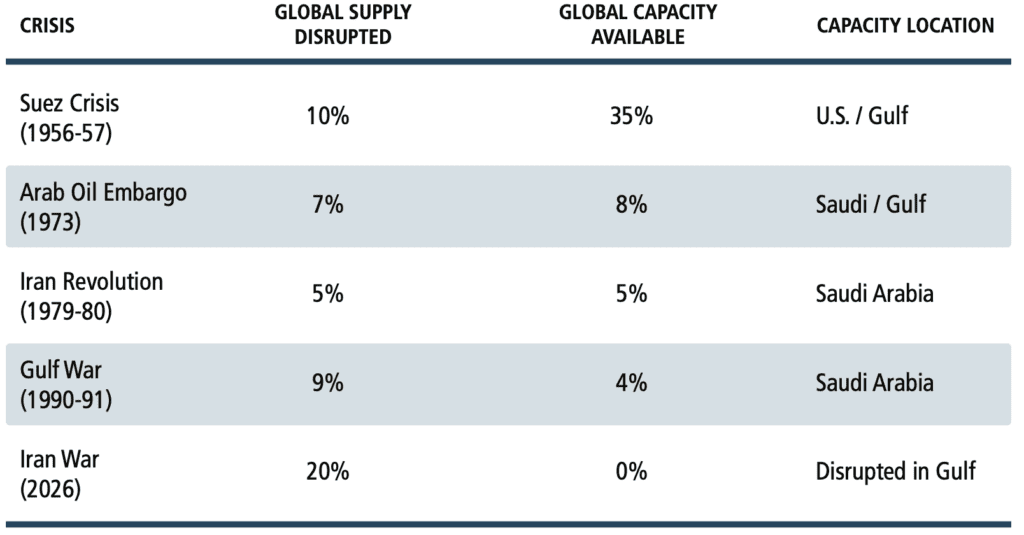
Source: Rapidan Energy
Most of these prior oil shocks are well known; the lesser-known Suez Crisis refers to Egypt’s invasion by Britain, France and Israel in 1956. The closure of the Strait disrupts up to 20% of the world’s daily oil supply that flows through it. As Table 1 shows, today’s shortfall is twice the size of the previous largest disruptions and almost three times as large as the one experienced during the Arab Oil Embargo in 1973.
In each prior oil crisis, there was also a ready source of spare capacity available to mitigate the shock. The world’s swing producers with excess capacity have typically been Saudi Arabia and the United Arab Emirates (UAE). With no major shipping lanes available to transport their oil, virtually all Gulf nations have cut their production as they run out of storage space.
In the meantime, Iran continued to export its own oil through the Strait; Iran’s daily shipping volume was estimated to be 1.5-2 mbpd in the month of March. From a virtual standstill in early March, Iran also began to allow vessels operated by either its allies or those willing to pay a hefty toll to traverse the Strait. At the same time, Saudi Arabia and the UAE have used some of their bypass pipelines to reroute the flow of oil away from the Strait.
We estimate these changes have reduced the daily oil supply shortfall to around 10-12 mbpd. At the outset, as much as half of this unfulfilled demand may have been met from the release of strategic reserves and inventory drawdowns. However, these measures can only provide temporary relief as they eventually dwindle over time.
The most fundamental fix to a persistent supply-demand imbalance eventually comes from demand destruction. Even in this regard, the demand for oil is fairly inelastic and unresponsive to price increases in the short term. Aggregate global demand was estimated to be 100-105 mbpd before the conflict began. Most estimates peg the immediate decline in aggregate demand at 2-4 mbpd after the first six weeks of the war.
Against this backdrop of supply and demand dynamics, it is no wonder then that oil prices adjusted rapidly and violently in the first month of the war. From a low of $60 per barrel in early January, Brent crude oil futures nearly doubled to almost $120 per barrel by late March. Prices have since ebbed and flowed as hopes of a sustained ceasefire have alternated with concerns about renewed escalations.
We next look at the likely evolution of this crisis from here on and its impact on growth, inflation and interest rates. We focus mainly on the U.S. economy and markets but highlight some key regional differences along the way.
Potential Impact of Higher Oil Prices
Then and Now
We look for historical precedents to inform our current views and find wide variations in oil price increases and prevailing macroeconomic conditions across previous oil shocks. We look for common themes across five previous incidents: Arab Oil Embargo in 1973-94, Iran Revolution in 1979-80, Gulf War in 1990-91, Iraq War in 2003 and Russian Invasion of Ukraine in 2022.
Oil price increases were the most severe during the oil shocks of the 1970s; they nearly quadrupled in 1973 and more than doubled in 1979-80. It was also a period of high inflation and high policy rates e.g. Fed funds rate of more than 10%. The Fed was initially concerned about the adverse effects on growth of even more tightening but eventually came around to it with the focus squarely on the inflation side of the dual mandate.
The same Fed storyline played out in 2022. Inflation in the U.S. was already on a spiraling trajectory from excessive post-Covid stimulus even as Russia invaded Ukraine. Oil prices jumped well above $100 and further spurred Fed officials who were already intent on combating an unprecedented surge in inflation from excess demand.
The Gulf War in 1990-91 produced the classic monetary policy cycle. The Fed continued its tightening cycle, which was already underway before the war broke out and oil prices doubled but then began to ease in late 1990 as the U.S. slipped into a mild recession. The Iraq War in 2003 came on the heels of a protracted bear market in global stocks from 2000 to 2002 during the dot.com crash. Inflation was already low and the Fed was concerned about upending a nascent and fragile economic recovery. The Fed stayed on hold based on concerns about slipping back into another slowdown or tipping disinflation into deflation.
The brief recap above doesn’t reveal any obvious answers but may still help shape our thinking.
The current backdrop in the U.S. is best summarized as follows. The U.S. economy continues to remain resilient. Despite the headwinds of higher tariffs, government job cuts and a government shutdown in 2025, U.S. real GDP growth was a solid 2.2%. While the job market has shifted into a lower gear with just modest job growth, the unemployment rate remains low. The U.S. is energy-independent now and a net exporter of oil. The U.S. economy is also far less energy intensive today than it was in the past. We are more immune to an oil shock than ever before.
Inflation has been steadily declining from its post-Covid highs in mid-2022. A number of disinflationary forces still persist: AI continues to increase productivity growth which helps bring prices down, growth in wages is muted, and shelter costs continue to fall. Fed policy is already restrictive and unlikely to revert to a tightening phase. Inflation expectations remain well-anchored, which should keep long-term interest rates from spiraling higher.
We carry forward this road map of the past and the present to foretell what may lie ahead.
U.S. Outlook
Any discussion of the future outlook is critically dependent on how long this energy shock persists. The longer the supply is constrained, the more likely demand destruction is to progress from discretionary spending to severe physical shortages and even rationing of oil, diesel and gas. It is in this phase that the crisis will bite into real economic activity and dent global GDP growth. This “prolonged war” scenario is not our base case; we assign a low probability to a significant supply shortfall persisting into 2027.
We assign a higher probability to a resolution in the coming weeks. Both sides embarked on a de-escalation trajectory by agreeing to a ceasefire on April 8, 2026. The ensuing peace negotiations failed to produce any agreement on the key topics of nuclear disarmament and the re-opening of the Strait. We expect that the issue of the Strait and the related oil shock will be resolved before a definitive agreement on the future of Iran’s nuclear enrichment program is reached.
We expect that progress to the eventual resolution will be bumpy and come in fits and starts; it may even be dotted by bouts of re-escalations by either party to force certain concessions. The latest development at the time of this writing in the form of a blockade of Iranian ports by the U.S. Navy is one such example of “escalate now to de-escalate later.”
With this forward perspective, we offer the following updates to our 2026 forecast in the current fallout from the war.
Inflation and Interest Rates
We believe that a number of disinflationary forces will continue to help offset any upward inflationary pressures from higher energy and food prices. Prior to the war, we had expected most measures of inflation to descend towards 2.5% by the end of 2026. In the aftermath of the war, there may be an upside of +0.4-0.6% to headline inflation by the end of 2026. By definition, core inflation excludes food and energy prices; the impact of the oil shock on core inflation will be more muted and likely in the range of up to +0.1-0.2%.
We expect the market to “look through” potentially higher headline inflation as a transient blip. Even if we see a modest uptick in core inflation, the Fed still has room to cut rates once or twice in the second half of 2026. If the uptick in core inflation doesn’t materialize, we would assign a meaningful probability to even a third rate cut. With inflation expectations well-anchored, we see no reason for the 10-year bond yield to divert from our original forecast of 4.0-4.2% at year-end.
Economic and Earnings Growth
We had called for a rebound in U.S. GDP growth to about 2.5% in 2026. Based on our expected timeline of events, we see limited downside to this forecast in the likely range of -0.1% to -0.2%. We assign extremely low odds to a U.S. recession as a result of the war.
The much-feared demand destruction from higher oil prices has yet to show up in company earnings estimates for 2026. In fact, in a remarkably surprising twist, projected company profits have actually gone up during the seven weeks of the war instead of being revised lower! It is conceivable that company management is unable to provide forward earnings guidance to analysts given the extreme macro uncertainty and that profits may eventually get slashed. But for now, earnings growth for 2026 and 2027 is well above 18% and 16% respectively; in each instance, earnings growth is projected to be higher now than it was at the beginning of the year. We assign extremely low odds to a bear market in U.S. stocks as a result of the war.
Regional Differences
North America is the most impervious to the adverse impact of an oil shock. The U.S. and Canada both have strong domestic production, large inventories and flexible refining systems. At the other end of the spectrum, emerging economies in Asia and Africa are the most exposed. They have high dependence on imported oil, limited inventories and inadequate fiscal resources to contend with shortages. Many countries in this group have already moved to a four-day workweek, closed universities, capped fuel purchases, and even introduced alternate driving days.
China is more protected than its neighbors in Asia because of large reserves in excess of a billion barrels, domestic coal reserves and strong state control over the energy grid. Europe is somewhere in the middle of the pack. It has more storage, more refining and greater policy flexibility than many other importers. But it is also more dependent on gas and diesel, which would remain disrupted and scarce during a prolonged energy crisis.
We complete the commodities theme with a brief discussion of gold.
Unsafe Volatility in Gold
Gold is an unusual asset. Unlike stocks and bonds, it offers no cash flow; it instead delivers its total return solely from price changes. It is considered to be a fairly stable store of value and, therefore, is best positioned as a safe haven during periods of distress and uncertainty.
The recent unexpected energy shock from the war in Iran would appear to be the perfect backdrop for gold to hold its own as a portfolio hedge. Instead, gold lost its purpose and lustre right when it was needed the most. The drawdown in gold exceeded the declines in U.S. and foreign stocks as it provided neither portfolio protection nor an inflation hedge.
We examine whether the gold price action in the last couple of years can be explained by fundamental factors or whether there may be other factors at play.
Fundamental …
As unusual as the decline in gold in March was, it is at least partly explained fundamentally. In one basic way, gold behaves like inflation-protected bonds, e.g. it generally protects principal net of inflation. However, unlike inflation-protected bonds which offer a yield, gold does not pay any interest. It is, therefore, quite common that gold performs poorly when these inflation-indexed payouts, or real yields, rise and make gold less attractive.
An increase in future growth expectations is another common reason for real yields to rise. We have established that gold typically performs better during periods of stress when growth typically becomes scarce. As a corollary, when growth becomes abundant as indicated by a rise in real yields, gold conversely underperforms. The negative correlation between real yields and gold at least partially explains gold’s poor performance in March.
One of the surprising market dislocations in March was the increase in nominal 10-year bond yields, which rose from around 3.95% to 4.40%. Even though high oil prices threatened a short-term increase in inflation, long-term inflation expectations stayed relatively flat. Nominal yields are comprised of two components: inflation expectations and real yields. Since inflation expectations did not budge, all of the 0.45% rise in nominal yields came from an increase in real yields.
The rise in U.S. real yields fundamentally explains gold’s decline in March.
We also offer a couple of fundamental and structural reasons for the rise in gold prices through 2024-2025.
We are also able to explain the strength in gold prior to the war with fundamental factors. The biggest motivation for holding gold in a portfolio is to guard against the potential debasement of money. As debt burdens and fiscal deficits mount around the world from significant government spending, concerns about currency devaluations have grown and fed into gold’s popularity.
Another structural source of demand has emerged from institutional investors and central banks. With concerns about the dollar and dollar-denominated safe assets, gold has been viewed as a useful diversifier in portfolios and central bank reserves. For countries worried about Western sanctions where foreign exchange reserves may get frozen, gold also becomes a convenient hedge against the weaponization of the dollar.
… or Speculative?
While we believe that gold’s price changes were catalyzed by the fundamental factors above, we are hard pressed to understand the sheer magnitude of those moves e.g. a spectacular spike of +60% in about 6 months up to early 2026, and then a drastic decline of -17% in 2 weeks in March.
These large moves suggest excessive risk-taking in the form of leveraged bets and speculative positioning. Just as they would explain the outsized moves to the upside, the mirror image activities of deleveraging on one hand and profit-taking on the other played a likely role in the sharp selloff during the war.
We have also seen an increase in the positive correlation between gold and other speculative assets, which further adds credence to the belief that gold has also assumed some of their same meme-like qualities. We alert our readers of these speculative possibilities in determining gold’s appropriate role and allocation in portfolio construction.
Summary
The scope and spillover of the war so far has exceeded our initial expectations. However, we remain in the camp of a quicker resolution than many fear. Here is a brief summary of our key observations.
- We began a trajectory of de-escalation in early April, which is unlikely to be reversed in any significant manner.
- We have likely rebounded from the March 30 intra-year low of stock prices for the rest of 2026.
- Markets will likely look through any increases in headline inflation as transient.
- There may be small upside risk to our original forecast of 2.5% core inflation, potentially up to 2.7%.
- There may also be small downside risk to our original forecast of 2.5% real GDP growth, potentially down to 2.3%.
- Stellar earnings growth in both 2026 and 2027 will support U.S. stocks; we expect the S&P 500 to still achieve our original forecast of 7,400-7,500 or above by the end of 2026.
- The 10-year Treasury bond yield should also remain right at our original forecast of 4.0-4.2% by year-end.
- We assign a very low probability to both a U.S. recession and a bear market in U.S. equities.
While the recent macro turmoil was higher than our initial expectations, we see it subsiding in the second quarter. We believe the U.S. economy still enjoys strong fundamentals and should normalize at a higher, steadier growth rate.
At the same time, we are acutely aware that the U.S. is at war, uncertainty still remains high, and any irrational misstep by any one of several actors can prove to be costly and punitive. As a result, we are exercising an elevated level of care and prudence in portfolio management.
To learn more about our views on the market or to speak with an advisor about our services, visit our Contact Page.