At the beginning of 2017, we wrote about an impending synchronized revival of global growth. While we saw uniformly stronger growth around the world last year, we now observe divergent regional growth trajectories.
On the heels of fiscal stimulus and deregulation, the U.S. continues to dominate the growth story. Real GDP growth of 4.2% in the second quarter has now moved its year-over-year growth rate up to 3%. By the same token, earnings growth in the U.S. has been nothing short of spectacular at 25% for each of the first two quarters.
The rest of the world has struggled to sustain last year’s momentum for a myriad of reasons. Higher tariffs imposed by the U.S. have taken their toll on Europe and China. Europe has also been hobbled by slowing business activity and a brewing debt crisis in Italy. China’s effort to reconfigure the composition of its economy towards greater consumption has been hampered by slowing demand, a weaker currency and greater capital outflows. The United Kingdom is experiencing slower growth after the Brexit referendum and is still struggling to finalize a deal on exiting the European Union. And, finally, many emerging markets have collapsed into a bear market under the weight of rising debt burdens and falling currencies.
We examine the more notable drivers for this divergence in the following sections.
U.S. Strength
The Goldilocks theme that we highlighted last quarter continues to play out in the U.S. At the margin, U.S. economic growth has become stronger in the last few weeks. The unemployment rate for September dropped to a 50-year low at 3.7%. Even as new jobs for September came in below expectations, payrolls for the previous two months were revised higher by more than 80,000. The ISM indexes for manufacturing and services activity remain at high levels as do various gauges of consumer confidence. Incomes are rising and so is consumer spending.
Interest rates have risen in September and in early October to 7-year highs. The 10-year Treasury bond yield is close to 3.25% and the yield curve is now steeper as a result. The rise in long term interest rates has come mainly from higher real rates which in turn validates the growth narrative.
Figure 1: Global Earnings Trends

We next look at earnings trends here in the U.S. and compare them to those in other regions of the world in Figure 1.
We highlight key observations from the most recent trends.
- The global earnings recession in 2015-16 set the stage for a subsequent recovery. The earnings recession was more severe outside the U.S.
- The revival of earnings growth was well synchronized in 2017 as was economic growth. It was also more pronounced outside the U.S.
- And, finally, as we show in the inset, earnings growth has continued to rocket ahead in the U.S. in 2018 but has stalled meaningfully in Europe and in the emerging markets.
Even as growth gathers steam here in the U.S., inflation remains contained. Most measures of core inflation remain in the modest 2 – 2.5% range. Average hourly earnings are still growing at less than 3% which is well below levels seen prior to recessions.
We move on to the more interesting discussion of weakness in foreign economies and the decoupling of global growth.
Non-U.S. Weakness
The divergence in economic, earnings and market performance between the U.S. and the rest of the world can be traced to many different factors. Our scope of discussion here is limited to the more important themes of trade, debt and currencies.
Trade and Tariffs
We spoke to this topic at some length in our last commentary. We have long maintained that U.S. tactics are designed to achieve greater parity in global trade rather than to seek out a global trade war.
Consistent with that notion, the U.S. was recently successful in renegotiating the old NAFTA agreement. In separate bilateral discussions, the current administration was able to get some concessions from Mexico and Canada and deliver on its campaign promises to redefine trade arrangements.
Figure 2: Largest U.S. Trading Partners

While the new trade terms may not be markedly different from the older ones, the breakthrough was an important marker in asserting U.S. influence in bilateral dialogues. As Figure 2 above shows, it also removed uncertainty in trade flows with two of our most significant trading partners.
We believe that the new USMCA deal creates a template for other successful trade resolutions with allies like Europe and Japan. It is likely that we get at least one more new trade agreement with an ally before the mid-term elections.
The U.S.-China trade tensions have continued to escalate in the meantime. We believe that there is no easy or quick solution to this dispute. The divide between the two sides spans a broad range of topics—from the size of the trade deficit to technology transfers and the theft of intellectual property—and seems too big to bridge any time soon. We expect the battle to continue into 2019 and believe that things will get worse before they get better.
Despite that pessimism, we don’t believe that a singular U.S.-China trade dispute will meaningfully impact global growth. Our optimism is based on a view that the U.S. and Chinese economies just don’t rely on their total exports, and their own bilateral trade, to the extent that many suspect.
Potential Debt Crises
We focus on two parts of the world which have the makings of a pervasive debt crisis. We also examine the risk of contagion to the rest of the world from these sources.
Emerging Markets
The woes of the emerging markets in 2018 have been well documented. These problems are best exemplified by China where stocks have fallen into a bear market and the currency has experienced a correction. A good portion of the slowdown in China’s economy can be attributed to its ongoing trade war with the U.S. The overhang from China’s trade problems have also weighed on other stock markets in emerging economies.
We focus more narrowly on the unfolding debt crisis in emerging markets. Most of the debt issuance in the emerging markets tends to be U.S. dollar-denominated. As the Fed continues to tighten and U.S. rates continue to rise, the dollar has continued to strengthen. This combination of higher U.S. interest rates and a stronger dollar has made it more expensive to service emerging markets debt. Emerging markets currencies have cratered and domestic inflation and interest rates have shot up.
The Turkish lira has fallen by almost -40% in 2018 while the Argentine peso is down over -50%. Both economies have used foreign borrowing to fund domestic growth. Inflation in Venezuela has come unhinged and short-term rates in Argentina have shot up to over 60%.
Countries with large current account deficits, high levels of external dollar debt and political instability tend to be most vulnerable to debt crises. Turkey has chronically been identified as fragile in this regard. Brazil, Indonesia and South Africa have fallen into this category in the past whereas Argentina and Egypt are among the countries most vulnerable at this point.
We believe that these developments will create a lot of pain in the local emerging markets. It is likely that Turkey will experience a deep recession. But at this point, we expect the fallout to remain contained and not spill over into the global economy. Our optimism about limited contagion is based on the small size of potential transmission mechanisms.
We illustrate our point by using Turkey as an example.
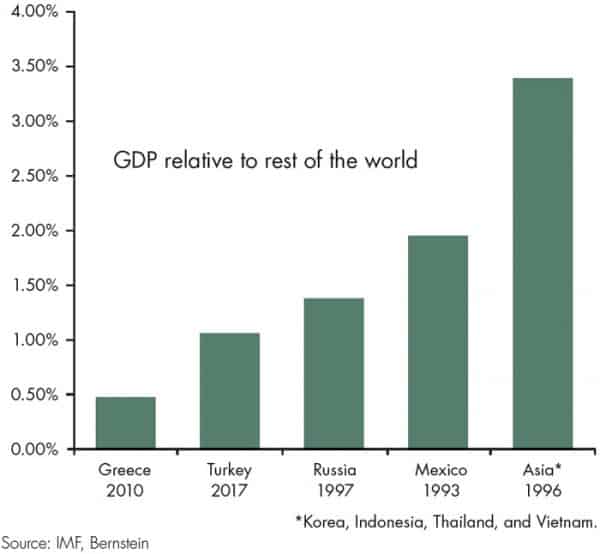
Figure 3: Size of Turkey’s Economy

Figure 3 shows that Turkey’s GDP is 1% relative to the rest of the world. Turkey is a far smaller economy now than the Asian economies were in the 1990s during their currency crisis. The risk of transmission to the U.S. through the banking sector also appears to be limited. Bernstein estimates that U.S. institutions own about $17 billion of Turkish debt. To provide context and perspective, that is less than 0.1% of U.S. annual GDP.
Italy
We switch to the developed world to focus on another debt crisis which is still in its early stages. The new government in Italy recently announced its budget proposals. The proposed plan to significantly increase budget deficits caught debt markets by surprise.
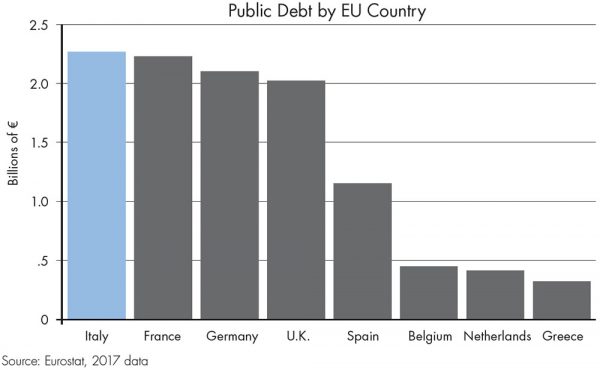
Figure 4: Europe’s Biggest Debtor

The concerns in the Italian bond market are easy to understand. As Figure 4 shows, Italy currently has the highest level of notional debt in the EU.
Italy also has the EU’s 2nd highest Debt/GDP ratio at 130%. Italy’s current credit rating of BBB at Moody’s is already on a negative watch.
The original projections of a tripling of the Italian budget deficit from 0.8% to 2.4% of GDP have since been revised lower. The new projections call for an easing of the budget deficit to 2.1% in 2020 and 1.8% in 2021.
We believe that these are still early days and a lot may change as the European Commission reviews and then approves the budget by October 15. We also note that budget deficits of around 2% are still below the EU-mandated ceiling of 3%. At the proposed levels, Italy would still not rank in the top ten countries globally based on budget deficit as a % of GDP. We are cognizant of contagion risks within the peripheral and broader EU and are monitoring developments closely. At this point, we do not assign a high probability to the risk of global contagion.
U.S. Dollar Strength
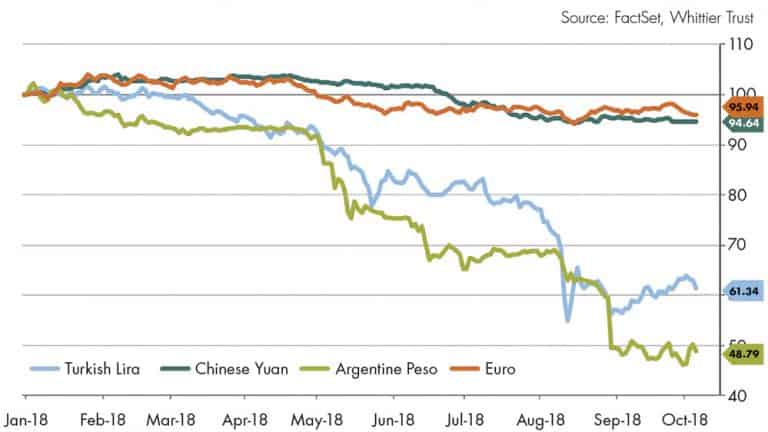
Figure 5: Global Currencies Versus U.S. Dollar

We discussed the adverse impact of a stronger dollar on foreign currencies in the earlier discussion. The likelihood of further weakness in foreign currencies represents another headwind for all non-U.S. markets. We illustrate the impact of negative currency returns in 2018 more vividly in Figure 5 shown above.
The sharp drop in the Turkish lira and Argentine peso overwhelm the smaller declines in the Chinese yuan and the Euro. It is interesting to note that the selloff in both the yuan and the Euro began after the announcement of U.S. tariffs.
We conclude our discussion of non-U.S. weakness by reflecting on a potentially adverse byproduct of continued dollar strength. We are mindful of the risks posed by a stronger dollar to profits of U.S. multinational companies. Currency translation effects would reduce foreign revenues and income, which are almost 50% of the total, for these multinational companies. While the trade-weighted dollar has leveled off in recent months, it remains a risk that we are monitoring closely.
Summary
After a brief period of synchronized global growth, the U.S. economy has maintained its strong momentum while the rest of the world appears to be slowing down. We attribute this outcome to the favorable policy tailwinds of fiscal stimulus and deregulation in the U.S. and the adverse impact of trade, debt and currencies in foreign markets.
The U.S. economy and stock market have significantly outperformed their non-U.S. counterparts in the last 10 years. We have been overweight U.S stocks relative to international stocks in client portfolios over this entire cycle.
With the decoupling of global growth in 2018, we also expect this trend to continue in the near term. We are aware that U.S. stocks have become more expensive in 2018 and foreign stocks have become cheaper. But we believe that the valuation differential appropriately reflects the difference in growth fundamentals between the two regions. We continue to favor U.S. stocks over foreign stocks and global stocks over global bonds.
Investment and Wealth Management Services are provided by Whittier Trust Company and The Whittier Trust Company of Nevada, Inc. (referred to herein individually and collectively as “Whittier Trust”), state-chartered trust companies wholly owned by Whittier Holdings, Inc. (“WHI”), a closely held holding company. WHI may utilize the services of its subsidiary, Belridge Capital, LLC, a SEC-registered investment advisor, to provide sub-advisory services for certain accounts and proprietary private fund investments.
This paper is provided for informational purposes only. The views expressed by Whittier Trust’s Chief Investment Officer are as of a particular point in time and are subject to change without notice. The information and opinions presented herein have been obtained from, or are based on, sources believed by Whittier Trust to be reliable, but Whittier Trust makes no representation as to their accuracy or completeness. Actual events or results may differ materially from those reflected or contemplated herein. Although the information provided is carefully reviewed, Whittier Trust cannot be held responsible for any direct or incidental loss resulting from applying any of the information provided. Company references are provided for illustrative purposes only and should not be construed as investment advice or a recommendation to purchase, sell or hold any security. Past performance is no guarantee of future results and no investment strategy can guarantee profit or protection against losses. These materials may not be reproduced or distributed without Whittier Trust’s prior written consent.
“The rise in long term interest rates has come mainly from higher real rates which in turn validates the growth narrative.”
“Earnings growth has continued to rocket ahead in the U.S. in 2018 but has stalled meaningfully in Europe and in the emerging markets.”
“We don’t believe that a singular U.S.-China trade dispute will meaningfully impact global growth.”
“We do not assign a high probability to the risk of global contagion from the debt crisis in the emerging markets or Italy.”
“We believe that the valuation differential between U.S. and international stocks appropriately reflects the difference in growth fundamentals between the two regions.”
From Investments to Family Office to Trustee Services and more, we are your single-source solution.

