Introduction
We highlighted the advent of a new economic cycle in our commentary at the beginning of the year. We observed that there were a number of aspects of this new cycle that were both unusual and underappreciated. An unusually strong consumer and unusually massive stimulus were two of the more powerful tailwinds for our constructive outlook. We also suggested that these factors had the potential to deliver upside surprises to growth in the next year or two. The first quarter of 2021 did get off to a good start on the growth front. GDP growth estimates have been revised higher from 3.5% in December to 6.5% for 2021 and from 0.5% to 4.0% for 2022. Similarly, S&P 500 earnings estimates for 2021 and 2022 are also higher than they were at the end of last year. While the upward revisions to economic and earnings growth have come as a welcome surprise so far, they have also unleashed a new fear for investors. They now worry that growth may be too strong and that inflation may be a bigger and more imminent risk than previously anticipated. A record surge in money supply growth, an accommodative Fed, an even more dovish Secretary of Treasury and the strength of the consumer have now squarely centered attention on inflation as a key market risk. We make the topic of inflation our singular focus in this article.
- Will the stronger-than-expected economy in 2021 trigger a rise in inflation over the short term?
- If so, how high could it go? What is the risk of runaway inflation like we saw in the 1970s? Will it moderate over the intermediate term?
- What is the secular outlook for inflation? Will we see a permanent upward shift in inflation over the next decade?
Inflation in The Short Term
Let’s answer the first question right away. We believe inflation will head higher in the short term because of two pandemic-related effects – pent-up demand and supply chain disruptions. The U.S. consumer is benefitting from strong fundamentals in incomes and savings, a healthy balance sheet and a stellar housing market. Wages and salaries rebounded to pre-pandemic levels in 10 months; retail sales did so in 5 months. While disposable income typically goes down during a recession, it increased by almost 5% in 2020 because of fiscal stimulus. The savings rate shot up dramatically upon the onset of the pandemic and still remains high at about 14%. High savings balances are likely to support future consumer spending. The red-hot housing market is supported by fundamentals of high demand and low supply. Higher home prices increase consumer confidence and also allow monetization of higher equity values. In the throes of the pandemic, supply chains were badly disrupted because of travel bans and stay-at-home restrictions. As demand has started to snap back, production has been unable to keep pace. It is quite common to see inventory shortages in many industries. These supply chain effects, along with pent-up demand, have started to show up in higher prices for purchased goods. Both the Consumer and Producer Price Indexes have now increased by more than 2% from their levels a year ago. It is worth noting that an initial increase in prices paid is a common and desired outcome in the early stages of a new cycle. But this initial rise in inflation brings us to a crucial juncture in developing our longer term outlook. Will the early trend extrapolate into runaway inflation like we saw in the 1970s? Or will inflation moderate over time and become more muted and contained? Let’s look beyond the short term to see how these early price pressures are likely to evolve.
A Comparison to The 1970’s
Here is a quick comparison of today’s conditions with those in the 1970s when inflation spiraled out of control. The concepts of demand-pull and cost-push inflation came into sharp focus during the inflation crises of the early and late 1970s. Inflation can surge in one of two instances – a demand shock may pull prices higher when demand exceeds supply or a supply shock may push prices higher from a rise in input costs. The two major episodes of inflation in the 1970s were more influenced by supply side shocks than they were by unusually high demand. Supply shocks in food and energy are generally regarded as the biggest contributors to the rise in inflation in 1973-75 and 1978-80. In October of 1973, OPEC imposed an oil embargo on the U.S. following its intentions to provide emergency aid to Israel. The ensuing production cuts nearly quadrupled the price of oil from around $3 per barrel to almost $12 per barrel. The second oil shock was also associated with events in the Middle East. The Iran revolution caused its oil production to drop by an amount equivalent to 7% of the world’s output by early 1979. Fears of similar disruptions in the region caused oil price to nearly triple in less than a year. The oil shocks became even more pronounced in the aftermath of President Nixon’s actions in 1971 to end dollar convertibility to gold. Prior to the decision, U.S. dollars were convertible into gold at a fixed exchange rate of $35 an ounce. The price of gold subsequently rose ten-fold over the rest of the decade. Since oil is priced in dollar terms, the resulting devaluation of the dollar forced oil prices even higher. In addition to these oil shocks, food shortages were experienced in both 1973-74 and 1978-79. And finally, the unwinding of wage and price controls also played a role in the inflation episode of the early 1970s. We believe that conditions for commodity supplies and currency stability are quite different today than they were in the 1970s.
- A big decline in global oil demand forced OPEC to cut production during the Covid recession. Unlike in the 1970s, there is significant excess capacity within OPEC as a result.
- The U.S. is now a bigger oil producer than before which creates additional supply capacity.
- The U.S. economy is far less energy-intensive than before. Energy consumption per $ of GDP has declined almost 10-fold in the last five decades.
- Technological advances have significantly increased agricultural productivity. Crop yields per acre have tripled since the 1970s.
- The U.S. dollar is likely to remain relatively stable in the foreseeable future based on its status as the world’s reserve currency and the strength of its domestic economy.
We assign a low probability to the possibility of runaway inflation that we witnessed in the 1970s. Let’s see if similar excess capacity or “slack” exists within the U.S. economy to mitigate inflationary pressures.
Slack in The Economy
A useful way to think about excess capacity in an economy is to compare actual economic output to its inherent output capacity. The inherent capacity of an economy is the value of its output if labor and capital are employed at their maximum sustainable levels. This level of output is called the potential GDP of an economy. Let’s define slack a little more formally in terms of an output gap. For economic growth, the output gap is the difference between actual and potential GDP. Output Gap = Actual GDP – Potential GDP When the output gap is negative, the economy is operating below its full capacity. When it is positive, the economy is above its capacity and likely to overheat. A negative output gap is disinflationary; a positive output gap is inflationary. Potential GDP of an economy is a theoretical construct and hard to measure. It is widely believed that the potential GDP of the U.S. economy is an annual growth rate of 2–3%. So how much slack do we have in the U.S. economy and what does it tell us about inflation? GDP growth estimates for 2021 and 2022 are 6.5% and 4% respectively. Since these growth rates are higher than the 2-3% range of potential GDP in the U.S., inflation is likely to rise in the next year or two. GDP growth is projected to normalize back down to the 2-2.5% range beyond 2022. At these levels, it will then be at or below the potential GDP of the U.S economy; this should allow inflationary pressures to abate over time. The concept of an output gap can be applied to other economic metrics like employment. It turns out there is even more slack in the U.S. labor market. The output gap for employment is negative today since actual employment is below full employment. As we discussed earlier, this reduces the risk of wage inflation in the foreseeable future. We illustrate the excess capacity in the labor market in Figures 1 and 2. Figure 1: Negative Output Gap – Unemployment Rate, %
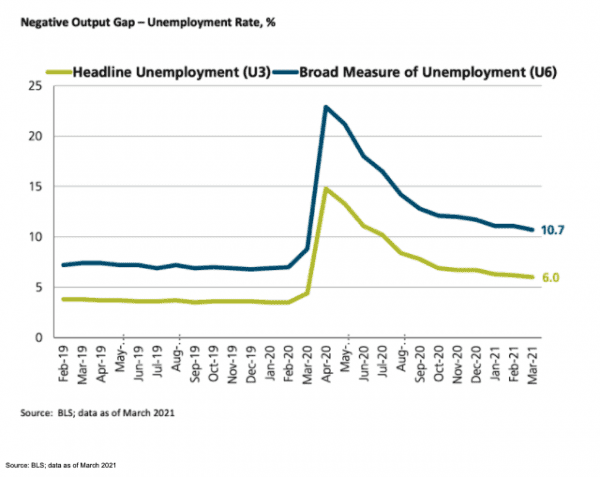
Source: BLS; data as of March 2021 We show two measures of the unemployment rate in Figure 1. U3 is the most common measure of the unemployment rate and represents the number of people actively seeking a job. The U6 measure is broader and also includes discouraged and underemployed workers. While both unemployment rates have come down, they are still above pre-pandemic levels. Higher unemployment rates suggests there is excess capacity and additional slack in the labor market. We reach the same conclusion by looking at net jobs lost from pre-pandemic levels in Figure 2. Figure 2: Negative Output Gap – Total U.S. Payrolls in Thousands
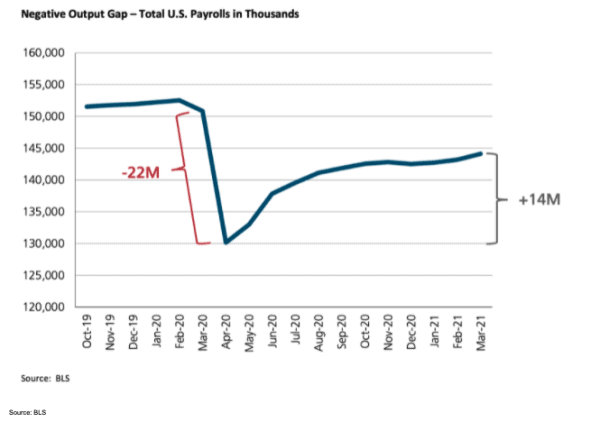
Source: BLS Despite the recovery in the labor market, there are still 8 million fewer jobs than 2019. Since actual employment is below full employment, we expect wage inflation to remain muted in the near term. But, what happens when we do reach full employment? During the last expansion, the unemployment rate fell as low as 3.5% and yet failed to trigger a rise in inflation. We examine the historical relationship between unemployment and inflation more closely in our next section. We also explore another key macroeconomic relationship in more detail … between money supply and inflation. Market participants have noted the unprecedented growth in money supply. This has also been a historical precursor to higher inflation. And yet its recent track record has been mixed. Money supply increased sharply after the Global Financial Crisis, but we still did not see any meaningful inflation in the last expansion. Will these traditional macroeconomic relationships hold true in the future? If so, what can we infer from the current trends in unemployment and money supply? Or have they simply broken down as recent experience would suggest?
Traditional Macroeconomic Relationships
Conventional macroeconomic theory has long postulated that unemployment is negatively correlated with inflation and money supply is positively correlated with inflation. When unemployment drops, inflation generally rises and vice versa. And a rise in money supply is generally coincident with high inflation and vice versa. Let’s look at unemployment and inflation first. The inverse relationship between the two is often referred to as the Phillips curve in honor of the economist who first documented the connection. Figure 3 shows the Phillips curve as it was observed in the 1960s. Figure 3: Unemployment and PCE Inflation, Q1 1960 – Q4 1969
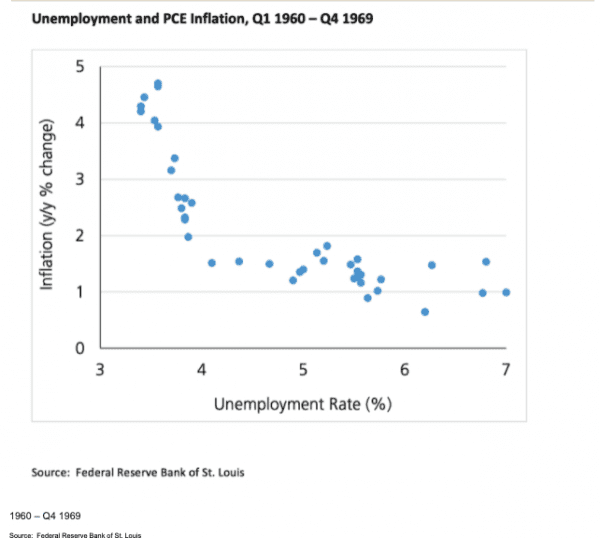
Source: Federal Reserve Bank of St. Louis We find a traditional inverse relationship between unemployment and inflation during the 1960s. But the relationship looks quite different since then. We discussed earlier that the 1970s inflation was more from cost-push effects than demand-pull dynamics. As a result, the 1970s saw an uncomfortable period of stagflation e.g. high unemployment and high inflation. The Phillips curve looks dramatically different over the last 5 decades as seen in Figure 4. Figure 4: Unemployment and PCE Inflation, Q1 1970 – Q3 2020
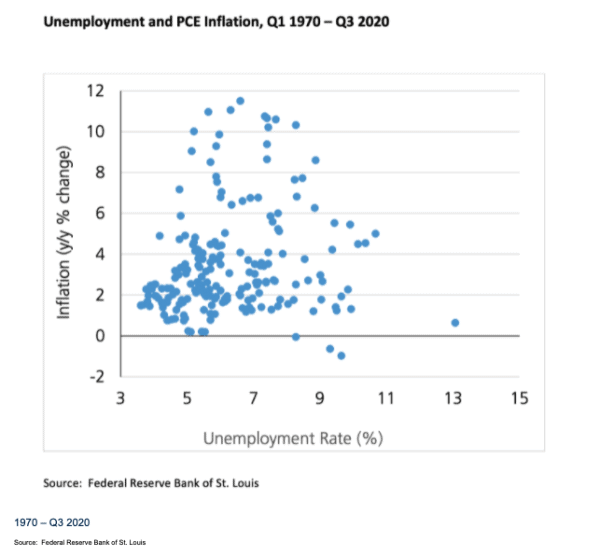
Source: Federal Reserve Bank of St. Louis We do not postulate a new causal or coincident relationship between unemployment and inflation based on the evidence above. We do point out, however, that the inverse relationship between unemployment and inflation has certainly broken down over the last 50 years. We provide some brief context for why the Phillips curve may not hold true today. The Phillips curve was never meant to define a long-term equilibrium relationship between unemployment and inflation; it was rather intended to capture short-term tradeoffs between the two. Over the years, workers have also lost their bargaining power to convert any increased demand for their labor into higher wages. Technology has further undermined human labor as automation has eliminated a number of low-skill jobs. The demise of unions and the evolution of more dominant employers has further reduced the bargaining power of workers. We believe that low levels of unemployment will not necessarily lead to higher wages and higher inflation. How about the growth in money supply? Rapid money growth has traditionally led to stronger economic growth and rising inflation. Money supply has grown by over 25% in just the last one year. Surely that sets the stage for significant inflationary pressures? Let’s also see how the relationship between money supply and inflation has changed over time. First, a quick definition of money supply. We use M2, a common measure of money supply, in our discussion here. It includes currency, checking and savings deposits, time deposits and retail money funds. Figure 5 illustrates the relationship between money supply growth and inflation from 1960 to 1989. Figure 5: Money Supply Growth and Inflation,1960-1989
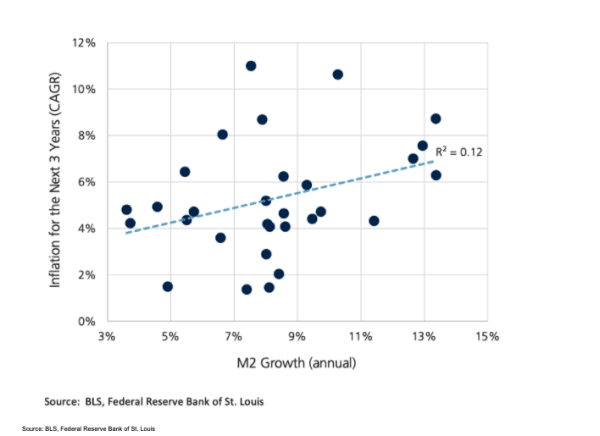
Source: BLS, Federal Reserve Bank of St. Louis We use core CPI as our measure of inflation. The Y-axis shows the annual rate of inflation for the next 3 years for each data point of annual M2 growth. The expected direct relationship between money supply growth and inflation holds true over these three decades. But much like the Phillips curve in recent years, this relationship has also broken down in the last three decades. We see that in Figure 6. Figure 6: Money Supply Growth and Inflation, 1990-Present
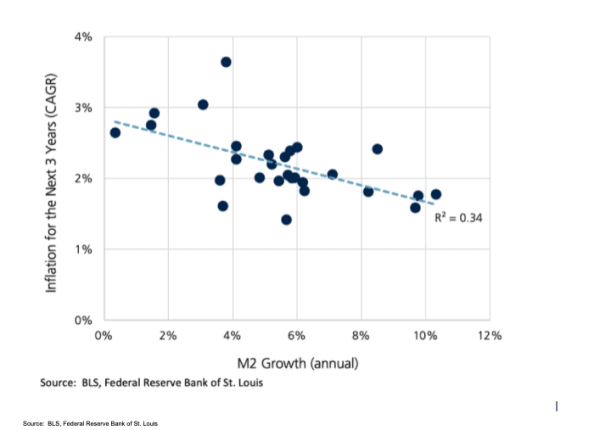
Source: BLS, Federal Reserve Bank of St. Louis Figure 6 may come as a surprise to many of our readers. We do not see a positive direct relationship between money supply growth and inflation over the last 30 years! We have observed for a long time now that monetary stimulus has been largely ineffective in spurring real economic growth. Multiple rounds of quantitative easing by central banks have neither sent the economy surging nor inflation soaring. Monetary stimulus has contributed more to inflation in asset prices than it has inflation in the real economy. Fiscal stimulus may yet have a more direct impact on growth and inflation as it ripples through the economy. We believe that the growth in money supply will be less inflationary than many fear. We close out our discussion by looking at a couple of secular trends that bode well for lower inflation over time.
Secular Disinflationary Forces
We highlight two secular forces that are likely to exert downward pressure on inflation over time – technology and international competition. Technology has been a powerful deflationary force globally for a long time now. We expect that its impact on inflation will be even more pronounced in the aftermath of the Covid recession. The pandemic gave rise to virtual workplaces with digital connectivity and accelerated the deployment of technology at an even more rapid pace than before. Technology has increased productivity, lowered production costs and provided price transparency. It has replaced human labor with automation and disrupted business models across a broad range of industries. Technology is no longer an independent vertical; it is instead a horizontal that cuts across virtually all sectors of the economy. The new wave of digital disinflation will benefit both companies and consumers. Companies will be able scale more rapidly by reaching global markets, create more efficient processes from automation, manage inventories in real time and reach consumers directly. Consumers will enjoy the benefits of choice, convenience and comparison shopping. Globalization of trade was one of the earliest catalysts for disinflation. Globalization allowed for worldwide integration of goods, services, people and capital. Companies came to rely on open borders to pursue the lowest cost of production. The pandemic highlighted risks to global supply chains from closed borders, travel bans and export restrictions. While this experience will inevitably lead to some degree of reshoring, companies will still continue to operate and compete globally. Global economic integration and international competition will continue to influence inflation dynamics. We know import prices have a direct effect on domestic consumer prices. A reduction in prices of foreign competitors can have an equally material impact on domestic prices. A number of academic studies have estimated that foreign competition has reduced U.S. goods inflation by about 0.5% to 1.0%. We believe that international competition and globalization will continue to remain disinflationary. We conclude with a summary of key takeaways.
SUMMARY
We believe that we are in the midst of a new economic cycle and a new bull market in stocks. We expect that growth will surprise to the upside in the next few years. This constructive backdrop for growth has renewed fears of higher and more imminent inflation. We address these inflation concerns over both the near term and in the long run.
- We believe that two effects related to the pandemic, pent-up demand and supply chain disruptions, will exert inexorable upward pressure on inflation in the near term.
- However, we expect inflationary forces will abate over time.
- Growth is projected to normalize from 6% in 2021 to between 2% and 3% by 2024.
- Unemployment and money supply have become less reliable predictors of inflation.
- Technology and international competition will likely moderate inflation in the long run.
We recognize we are in uncharted territory on a number of macroeconomic metrics. We have no historical precedent to assess the risks of unintended consequences. As a result, we approach investment decision-making with a heightened sense of humility and vigilance. We continue to maintain a pro-growth, pro-cyclical tilt and invest in high quality companies.
“Investors worry that inflation may be a bigger and more imminent risk than previously anticipated .”
“We assess the likely path of inflation in the short term and over the long run.”
From Investments to Family Office to Trustee Services and more, we are your single-source solution.

