Introduction
We begin the New Year on an optimistic note. We project that the coronavirus recession ended in the third quarter and a new economic cycle is underway. At this point, we assign a low probability to the odds of a double-dip recession. We discuss the rationale for our thesis in the following sections.
2020 will take its place in history as a year to forget, but it will yet be unforgettable. A global pandemic devastated the world’s economic order and, more importantly, inflicted indescribable human pain and suffering. Many lost their lives, even more lost their livelihoods and those who survived were left with permanent scars from a heightened awareness of human fragility and mortality.
Global economies and markets have so far created the unlikely outcome of a sharp V-shaped recovery … a scenario considered scarcely plausible at the depths of the downturn.
The S&P 500 index finished the year with a return of 18% after a 70% rebound from its March lows. The Russell 2000 index bounced back by more than 100% from its low to notch a gain of 20%. The Technology-laden Nasdaq Composite index posted a strong gain of 45% for the year.
The damage caused by the coronavirus was unprecedented at many levels. The subsequent recovery was also historic because of equally unprecedented activity on two different fronts — economic policy and medical innovation.
- Central banks and governments all over the world came together
to inject massive monetary and fiscal stimulus into global economies. Policy interest rates went to zero and even into negative territory in many countries. Central banks expanded their balance sheets through aggressive bond purchases. Quantitative easing in the U.S., Europe, U.K. and China has reached almost $7 trillion! - Human ingenuity came to the fore in the efforts to develop a successful vaccine. No vaccine had ever been developed in less than a year; today we have several that are effective enough for emergency use. We also have several drugs and therapies which mitigate the likelihood of death.
In hindsight, the most remarkable aspect of these policy responses was the synergistic timing of progress on both fronts. Economic policy responses were swift and aggressive at the outset when medical research was just beginning. As medical innovation gathered speed, economic policy eased up … but never to the point of toppling economies off a fiscal cliff into the second leg of a potential W-shaped downturn.
Even as economies and markets began to recover, there was no shortage of worries for investors to fret about. Many of these concerns, such as election uncertainty and Brexit, have resolved themselves, but yet others persist even today.
- Pandemic – virus resurgence, vaccination logistics and mutant variants
- Debt – inimical impact on interest rates and inflation
- Perennial – climate change, income inequality and political polarization/li>
We believe these potential headwinds pose limited risk. The big breakthrough to end the pandemic has already been achieved in the form of successful vaccines. Interest rates and inflation are likely to remain low for a few more years and the perennial forces listed above are secular in nature whose effect will be spread out over several years.
We instead focus our attention in this discussion on the new economic cycle. We believe there are a number of aspects about this new cycle that are both unusual and underappreciated. We highlight three such themes and discuss them in greater detail.
- Unusual Consumer Strength
- Unusual Massive Stimulus
- Unusual Initial Valuations
We conclude with the portfolio implications of our economic and market outlook.
Unusual Consumer Strength
As is generally the case in financial crises, the U.S. consumer was significantly leveraged during the last recession in 2008. A lot of the leverage on consumer balance sheets came from home mortgages. Easy money and loose underwriting standards allowed consumers liberal access to subprime loans and eventually created a housing market bubble.
The same home mortgages were transformed and packaged into even riskier investments at financial institutions. Consumers eventually defaulted on these loans, home prices crashed, banks and investors suffered heavy losses, jobs were lost, incomes fell and savings declined as the Great Recession lasted 18 months. The U.S. consumer then had to endure a painful deleveraging cycle that lasted several more years and curbed consumer spending along the way.
Despite all the dire headlines of unprecedented unemployment, none of these conditions hold true today. It may come as a surprise to some that all the relevant factors from 2008 are now a strong tailwind for the U.S. consumer.
- Strong income, spending and savings fundamentals
- Strong balance sheets
- Strong housing market
Let’s take a look at how and why these consumer dynamics are different this time around.
Consumer Income and Spending
The impact of the coronavirus recession has been felt unevenly across the economy. The subsequent recovery has been equally uneven. The Travel and Entertainment sectors have been most heavily affected and Technology the least. In fact, the Technology sector has been a big beneficiary of the resulting stay-at-home protocols.
In this setting of both big losers and big winners, the overall impact of the pandemic on the overall economy has been more muted. For jobs lost at a local restaurant, there were offsetting ones created at an Amazon warehouse. The net result of this underlying economic dichotomy is that both consumer incomes and consumer spending made remarkably rapid recoveries.
Figure 1 shows the unusual V-shaped recovery in consumer wages.
Figure 1: Change in Wages and Salaries vs. Prior Peak
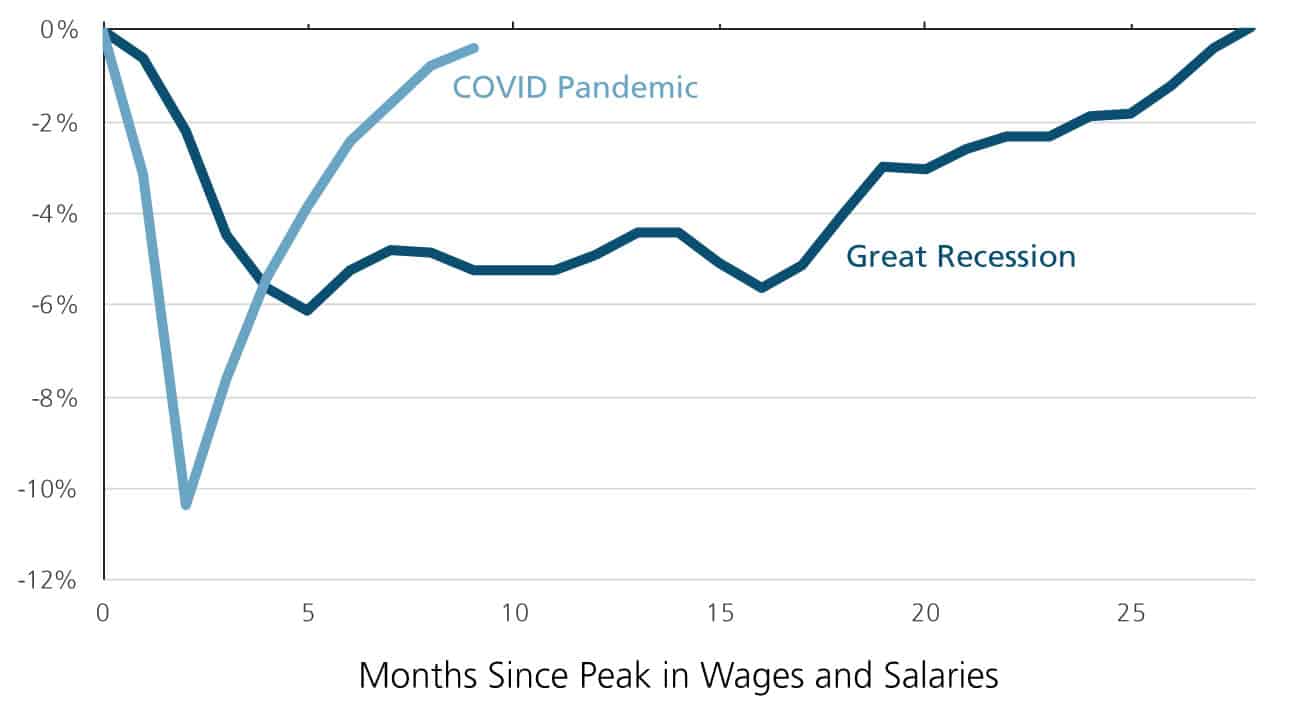
It is even more remarkable that this rebound in consumer income is based only on wages and salaries and does not include stimulus checks or unemployment benefits. The trajectory reflects the impact of business re-openings and the shift in the mix of jobs discussed above.
Here is a look at retail sales as a proxy for consumer spending. The V-shaped recovery in retail sales is even more stunning.
Figure 2: Change in Retail Sales vs. Prior Peak
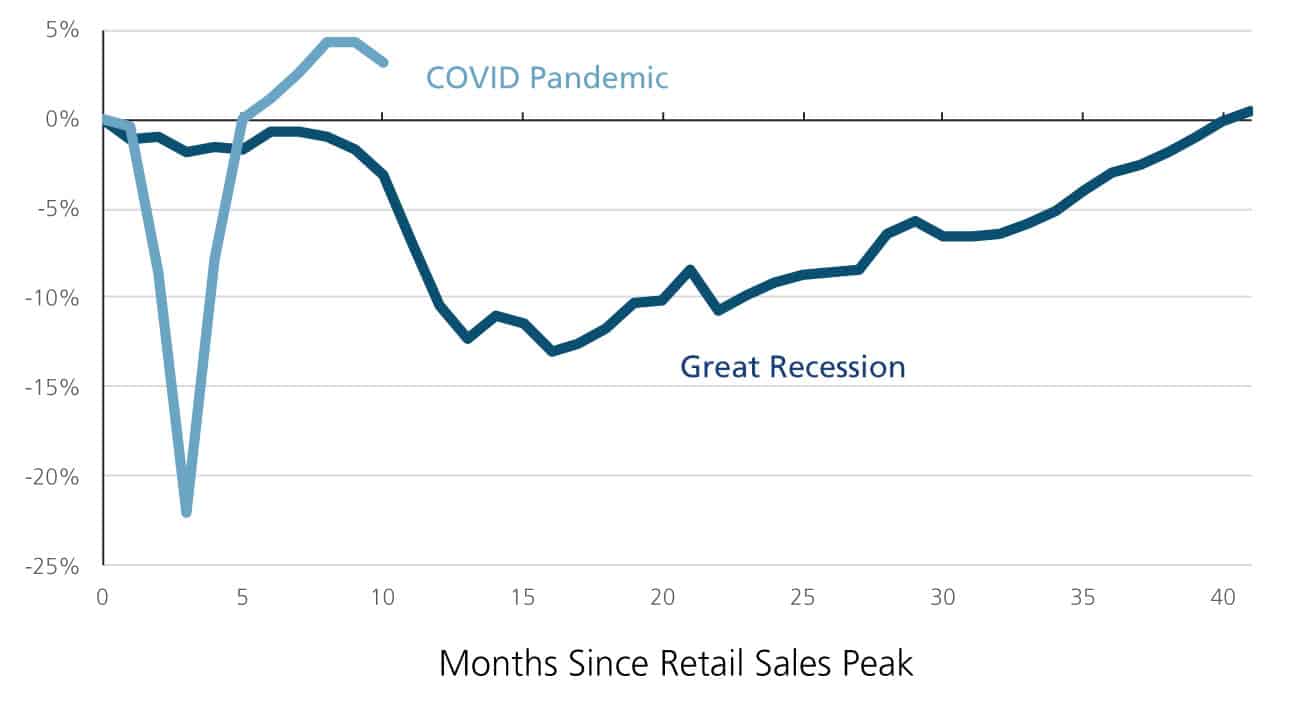
U.S. retail sales bounced back to pre-Covid levels in just 5 months during this recession. In sharp contrast, it took 40 months for retail sales to recover to their prior peak in the 2008 recession!
Clearly, the rebound in wages seen earlier helped the recovery in retail sales. But there is also an important shift in the mix of spending at play here. In a sharp reversal of the prior trend, consumers are now spending more on “goods” than they are on “experiences”. In many ways, this was a forced shift because the experiences of travel and entertainment were simply not available during the pandemic.
Consumer Balance Sheets
The consumer balance sheet reveals an even bigger surprise than the consumer income statement. It is customary to see the level of savings decline during a recession even though savings rates may go up on a precautionary basis. One of the most unusual elements of this cycle is the big increase in both the savings rate and the level of savings.
On the heels of the fiscal stimulus from the CARES Act, the personal saving rate shot up from 7% to a staggering 33%! While the savings rate has since come down, it still remains high at almost 13%.
One manifestation of a high savings rate is a higher level of cash on consumer balance sheets. The higher-than-normal savings rate and higher cash balances are bullish indicators; they form the basis for future potential spending.
The coronavirus recession has been unfairly, and asymmetrically, more punitive on lower income households. Have they been able to accrue the high savings rates discussed above? Has cash accumulated on their balance sheets? These insights are particularly relevant because they have useful economic implications. Lower income households are more likely to spend incremental savings than higher income households.
Here is our first look at consumer balance sheets. Figure 3 shows cash balances for the bottom 50% of households by wealth.
Figure 3: Cash Balances for Bottom 50% of Households by Wealth, billions
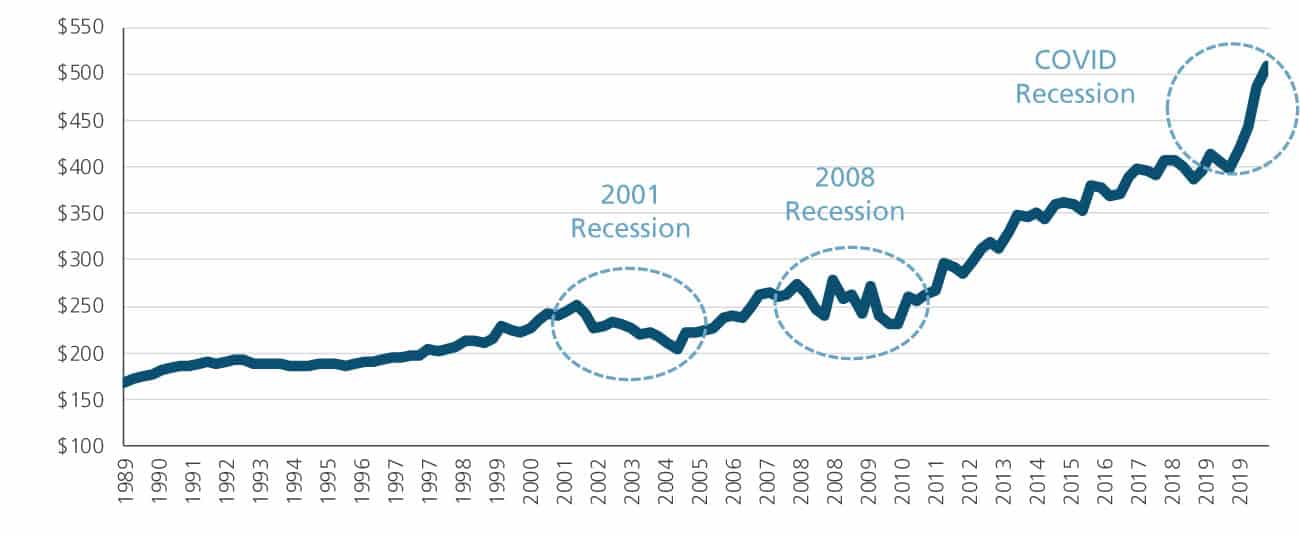
Cash balances for the same cohort declined in the two prior recessions of 2001 and 2008. During the Covid recession, cash balances for this group have gone up by more than 25%!
The big difference between prior recessions and this one is the huge fiscal stimulus that was put in place to replace lost income. With enhanced unemployment benefits, many households within this group reached incomes which exceeded their pre-crisis levels.
By this metric, balance sheets for consumers who were most affected by the pandemic are stronger than many may realize.
We turn next to the level of debt for consumers and the cost of servicing that debt. It is common to see variable debt, such as credit card debt, go up during a recession. Debt servicing costs tend to stay relatively flat as lower interest rates typically offset higher debt levels.
We look at the financial obligations ratio in Figure 4 as our metric for the impact of debt on consumer balance sheets. The measure is calculated as the ratio of required contractual payments to after-tax income.
Figure 4: Financial Obligations as Percent of Disposable Income
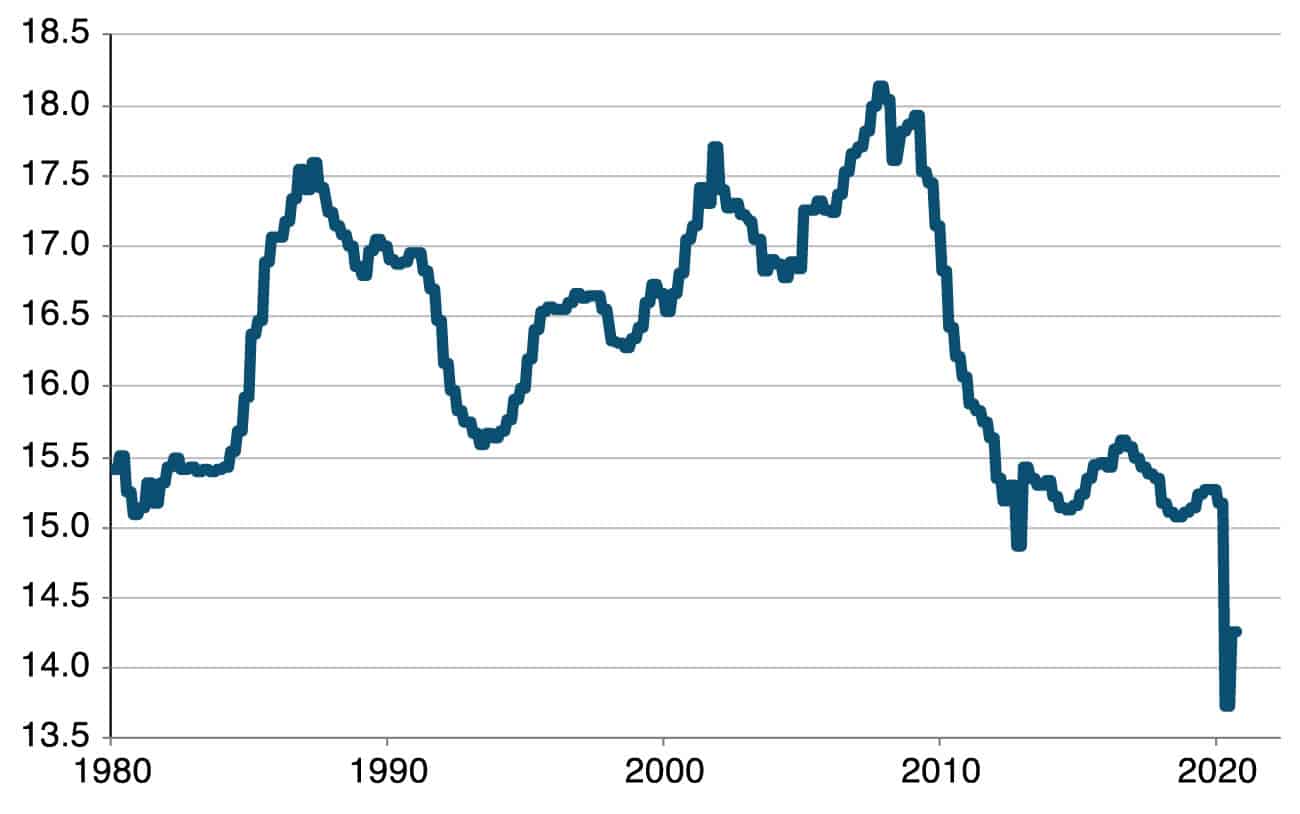
Figure 4 highlights yet another unusual aspect of this economic cycle. Financial obligations as a percentage of disposable income rose slightly in the 2001 and 2008 recessions. In the Covid recession of 2020, they fell to historic lows!
It is worth noting that a portion of the decline may be attributable to forbearance relief for mortgage and rent payments. But nonetheless, there were notable differences between the last recession and prior ones.
During the Covid recession, credit card debt actually went down, not up! Stay-at-home restrictions meant that there were fewer opportunities to spend. Interest rates went to historic lows which significantly lowered the cost of servicing existing debt. Mortgage refinancing surged to historic highs as we will see in the next section.
Consumer balance sheets are unusually healthier in this new cycle than they have been historically.
Consumer Home Equity
The highly contagious coronavirus has been more prevalent in densely populated metropolitan areas. High transmission rates and the trend towards work-from-home have driven an exodus from congested urban cities to sparse suburban towns. People have been willing to trade in their urban lifestyle of dining and entertainment for the space and safety of suburban living.
The housing market has been a big beneficiary of this pandemic-induced trend. Upscale, high-rent apartments in big cities remain vacant while suburban homes within driving distance are in high demand.
Home prices have been buoyed both by this surging demand and also record low mortgage rates. In 2008, the housing market crash saw home prices plummet. As a result, homeowners’ equity fell from a prior peak of above $14 trillion to below $10 trillion. In 2020, however, homeowners’ equity has maintained its upward trend and now stands at over $20 trillion.
The rise in home prices has helped the consumer in a couple of different ways. Coupled with the rise in stock prices, it has increased consumer net worth to all-time highs. This wealth effect traditionally bolsters consumer confidence and indirectly helps sustain consumer spending.
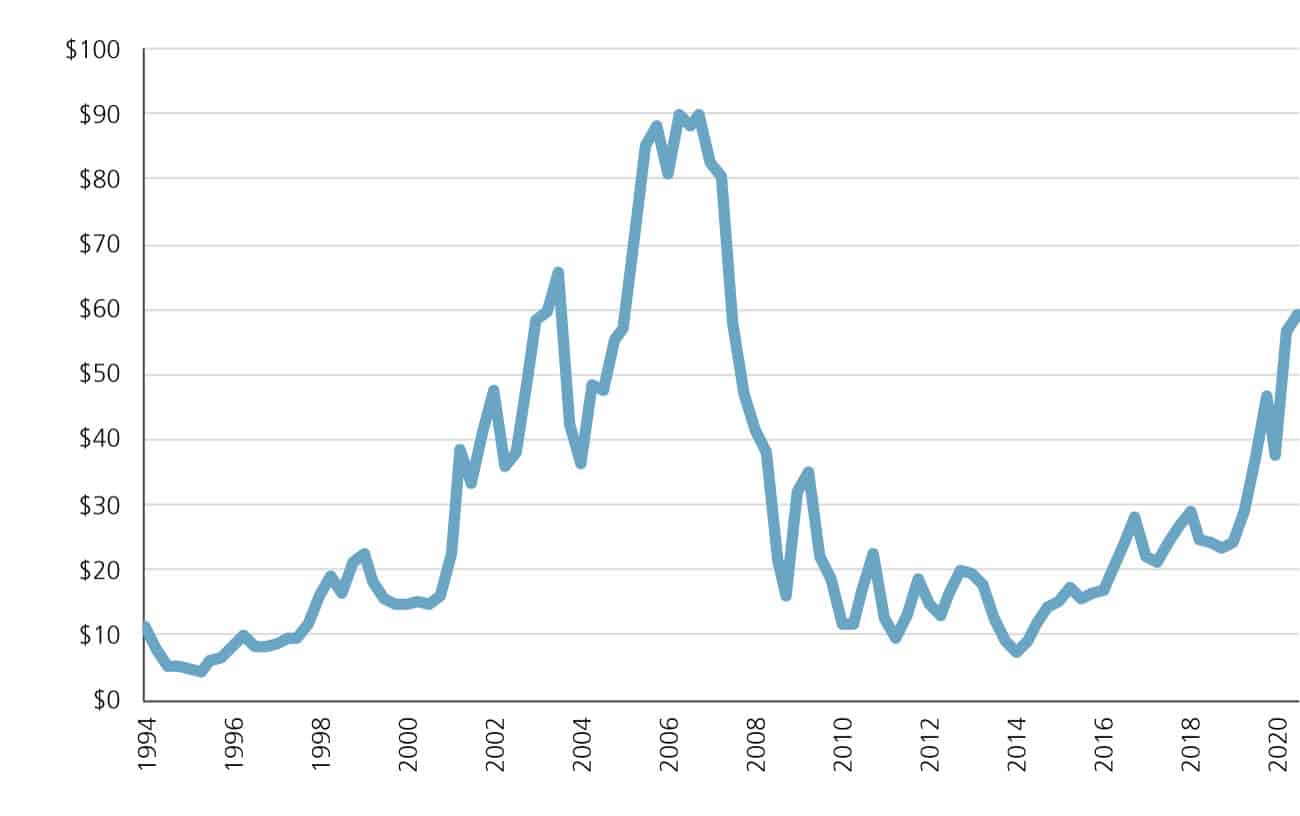
But there is a more tangible benefit to the consumer from today’s rising home prices and historically low mortgage rates. Consumers have been able to “cash out” the equity in their home with home equity lines of credit (HELOCs), mortgage refinancings (refis) and second mortgages (seconds).
We show this effect in Figure 5.
Figure 5: Home Equity Cashed Out (HELOCs, refis, seconds), billions
If our reader is worried at this point about the possibility of yet another imminent housing bubble, we quickly allay those concerns. Unlike 2008, the housing market is severely under-supplied at the moment. The rise in home prices in 2020 is based on fundamental supply-demand factors, not excess speculation. Demand is surging while the supply of homes is limited.
Here is a depiction of the contrast in housing fundamentals between 2008 and 2020.
Figure 6: Housing Market Remains Undersupplied
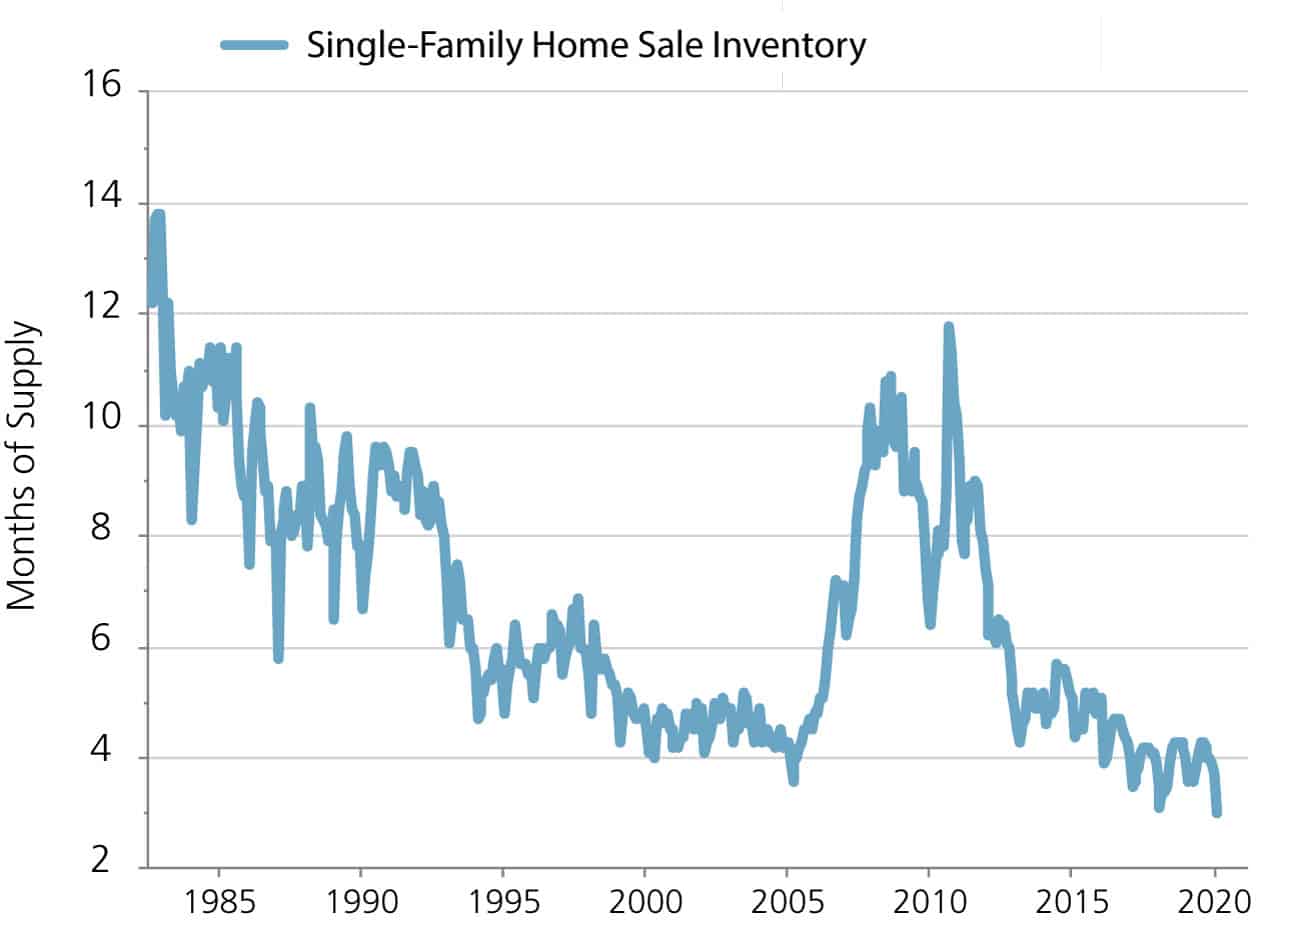
Home prices were rising from 2005 to 2008 even as the supply of single family homes was going up. In 2020, the inventory of single family homes is at an all-time low of 3 months of supply!
We suggest that the strong housing market today is an important and rational driver of consumer strength. It is also unusual in that it was derived from a rare confluence of events related to the pandemic. Rising home prices have increased consumer confidence through the wealth effect. They have also allowed consumers to unlock incremental cash flow to support spending.
We expect the housing boom to continue on the heels of secular trends in population growth, household formation and work-from-anywhere.
Unusual Massive Stimulus
The coronavirus pandemic brought an unprecedented level of economic devastation. U.S. GDP growth declined by a staggering -31.4% in the second quarter. Without a medical remedy in sight, the Federal Reserve Board (“Fed”) and Congress had no option then but to embark on stimulus to resolve the crisis.
The resulting flood of liquidity has made it easier to transition back toward business as usual. It has allowed enough time for vaccines to be developed, businesses to re-open and consumers to continue spending.
The sheer magnitude of the stimulus is unusual in a historical context. Here’s a look at how truly monumental it is.
- The U.S. government has announced a total of $3.9 trillion in deficit spending so far. That is a staggering 17% of the 2019 U.S. Gross Domestic Product of $21.4 trillion! And unprecedented in a historical context!!
- The Fed has increased its balance sheet by $3.3 trillion to above $7 trillion. It is projected to grow it to around $10 trillion by the end of 2021! Again, unprecedented!!
- To put the speed and magnitude of this quantitative easing into historical perspective, the Fed had increased its balance sheet during the Global Financial Crisis by a total of $4 trillion in 6 years!
- The Fed’s monetary stimulus has increased U.S. money supply by by more than 25% in 2020!
- U.S. short rates are at zero and projected to remain there until 2023. Global short rates have fallen from already record lows by another 100 basis points … to 65 basis points at the end of 2020!
We leave you with two key insights on the topic.
- Previous recessions have been fought with either monetary stimulus or fiscal stimulus, but rarely with both and never in this magnitude. It is highly unusual to see bipartisan support for such sizeable deficit spending to stimulate the economy.This dual catalyst to re-ignite economic growth is also a global phenomenon. The massive two-sided global stimulus should be further bolstered by the global “medical stimulus” of vaccinations.
- Monetary stimulus typically works on a lagged basis. Low interest rates and large bond purchases should continue to boost growth for several more quarters. Fiscal stimulus, on the other hand, ripples through the economy more rapidly. It also creates a bigger multiplier effect which in turn produces larger economic gains.
We believe that the unusual massive stimulus has the potential to create upside surprises to consensus growth expectations.
Unusual Initial Valuations
One of the most unusual aspects of this boom–bust–boom cycle is the current elevated level of P/E multiples for stocks. We assess if stocks are as hopelessly overvalued as many fear. If that is indeed the case, a new bull market in stocks is not viable. A crash in equity valuations could, in turn, derail any new economic engine of growth.
Earnings declined significantly in 2020 and are expected to revert in subsequent years. Specifically, earnings are projected to decline by about -16% in 2020 and then rebound by almost 22% and 17% in 2021 and 2022 respectively.
This volatile earnings trajectory is likely to also cause big swings in P/E multiples from year to year.
Figure 7: S&P 500 Price to Earnings Ratios
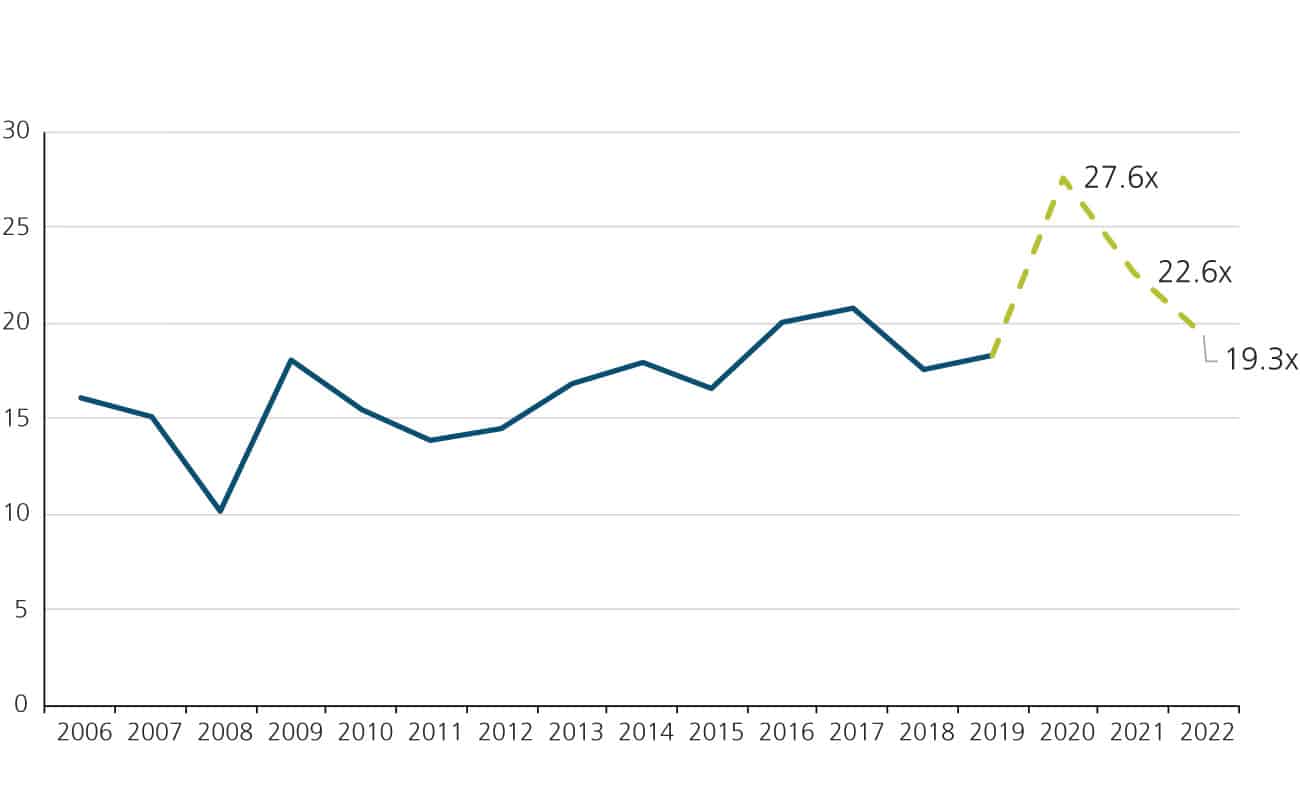
At this point, the stock market is already focused on 2021 earnings and beyond. Using those earnings estimates, the 2021 forward P/E ratio is above 22 times and the 2022 forward P/E ratio is almost 19 times.
These valuations appear high by historical standards. But we believe a comparison of P/E ratios to past averages only tells half the story. Historical fair P/E ratios were achieved in a very different interest rate regime. Today, short-term and long-term interest rates are historically low which has caused P/E ratios to re-rate higher.
A simultaneous look at stock and bond valuations is revealing. We compare the earnings yield for stocks, E/P which is the inverse of the P/E ratio, to the 10-year bond yield.
Figure 8: Yield Comparison – Stocks vs. Bonds, %
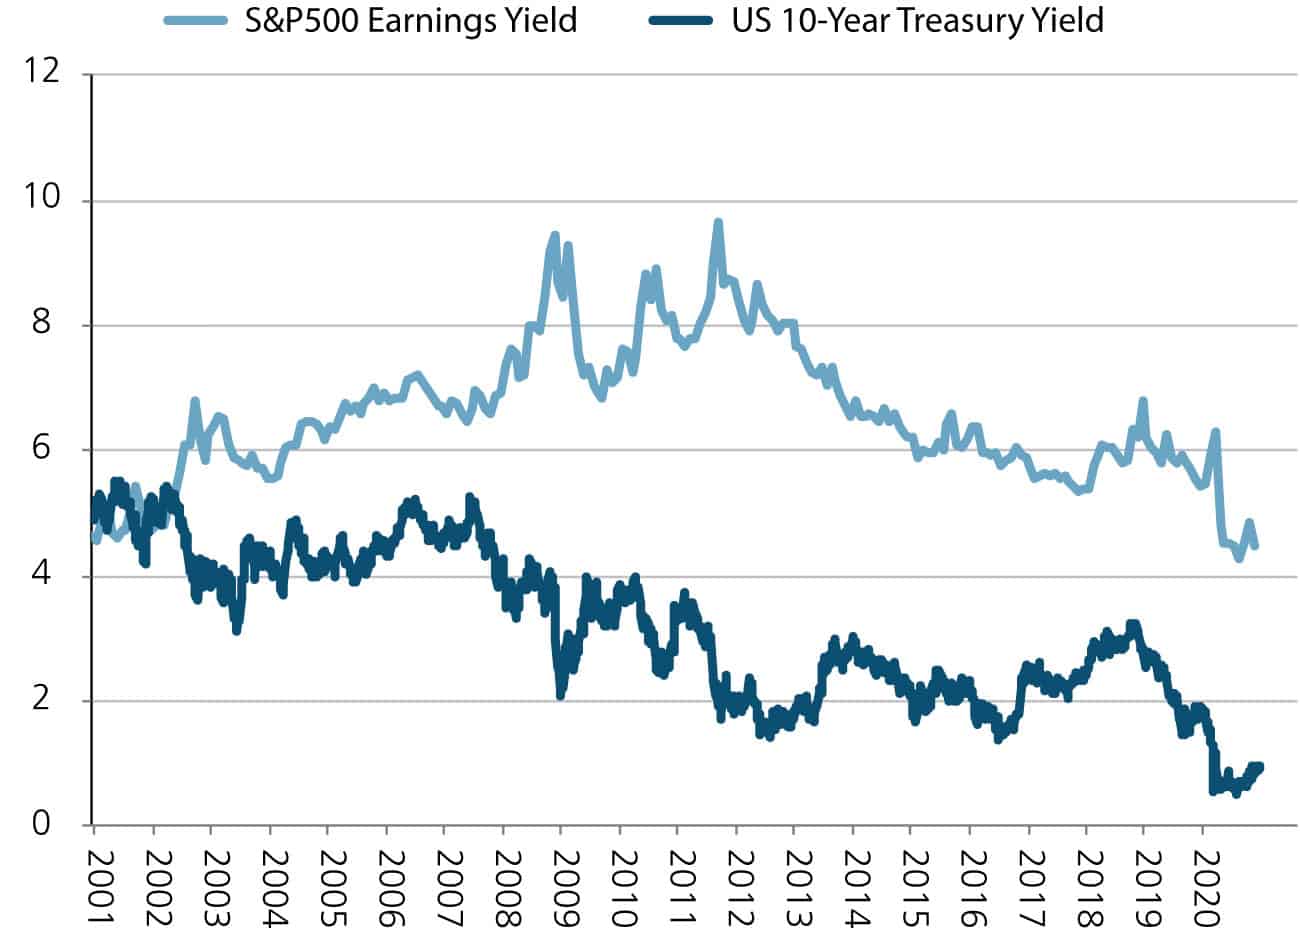
The wider the spread between earnings yield and bond yields, the more attractive stocks are to bonds. The steady decline in bond yields from above 5% to below 1% has allowed P/E ratios to expand in the face of modest growth.
For those who fear that stock valuations are currently in bubble territory, it is instructive to compare the spread in yields today to their levels during the Internet Bubble. Unlike in 2000-2002, the earnings yield on stocks in 2021 is significantly higher than bond yields. In this setting, stocks actually appear fairly valued or perhaps even modestly undervalued to bonds.
As long as the 10-year bond yield remains below 1.5%, we believe that stocks should be able to sustain forward P/E ratios of around 20 times in a stable growth environment.
But current valuations are already at those levels. We, therefore, assert that future stock market gains will accrue mainly from future earnings growth … and not from any further multiple expansion.
We believe that economic and earnings growth has the potential to surprise on the upside. We remain bullish on the economy and stocks.
Summary
The Covid recession will go down in history as the sharpest and shortest recession ever. As we embark on a new economic cycle, we leave you with the following takeaways for our economic outlook and portfolio positioning.
The new expansion is unusual in many ways, but most notably around the following themes.
- Unusually strong consumer will likely anchor strong GDP growth
- Unusually powerful policy stimulus may create upside growth surprises
- Unusually high initial stock valuations will require earnings growth to power a new bull market
In this pro-growth setting, we believe the following portfolio positions will likely be rewarded.
- Stocks will likely outperform bonds.
- Economically-sensitive sectors and asset classes will likely outperform in the short term e.g. Small Cap, Emerging Markets and Consumer Discretionary.
- High quality growth stocks should remain a good long-term choice for tax-efficient compounding of wealth e.g. U.S. Stocks, Technology and Communication Services.
- Credit will likely outperform duration in bond portfolios.
- Alternative investments like real estate, private equity and absolute return strategies will continue to play a key diversification role in portfolios.
We conclude on an abundant note of caution and vigilance.
We recognize that the current economic backdrop is unusual in many ways. We are especially mindful that these unprecedented conditions come with the inevitable risk of “unknown unknowns”.
We continue to carefully monitor markets, economies and client portfolios with cautious optimism.
“We project that the coronavirus recession ended in the third quarter of 2020 and a new economic cycle is underway.”
“The new economic expansion is unusual in many ways, but most notably around the themes of consumer strength, massive stimulus and initial valuations.”
From Investments to Family Office to Trustee Services and more, we are your single-source solution.

