Global equity markets are up significantly in 2019 as they continue to rebound from last year’s sharp selloff. The S&P 500 index reclaimed new highs on its way to a 19% gain in the first half of 2019, the Russell 2000 index of smaller companies rose by 17% and the global MSCI All Country index advanced by 14%.
The rally in stocks was driven by an abatement of risks on two fronts. Investors were concerned in late 2018 that a global recession was imminent. They were also fearful that central banks, and the Fed in particular, might commit a policy mistake in the face of the unfolding global slowdown.
Those fears seemed misguided in early 2019 as economic data in the US exceeded expectations and the Fed communicated that it would pause its tightening cycle. GDP growth exceeded 3% to end a series of seasonally weak first quarters and the labor markets got off to a good start.
A breakdown in US-China trade talks in April revived the same growth and monetary policy concerns all over again during the second quarter. May was particularly volatile with stock market declines of around -6%. However, these losses were quickly reversed in June as the US and China met on the sidelines of the G20 summit and called a truce on the trade war. Additional tariffs were suspended and select sales to previously restricted Chinese companies were allowed to resume.
The sharp rally in stock prices in 2019 has raised questions about its sustainability. Have we moved too much too quickly? In a year of relatively flat earnings growth, the move in stock prices has been clearly driven by an expansion of the P/E multiple. Investors now wonder if these stock valuations are too high. The valuation question for stocks comes into sharper focus when investors assess the health of the global economy through the lens of the global bond markets.
In a confounding divergence, bond yields have moved sharply lower in 2019 which suggests that the global economy is still fragile and vulnerable. In an apparent flight to safety, bond prices have moved higher as yields have moved lower and bond market valuations have soared. Over 50% of the developed markets’ sovereign bonds are now trading at negative yields and the US 10-year Treasury bond is yielding a meager 2%.
This backdrop allows us to highlight the valuation conundrum between stocks and bonds.
- Are economic risks properly captured in stock valuations or bond valuations?
- Are stocks overvalued in light of where we are in the economic cycle?
- Investors are clearly willing to pay the high cost of safety in the bond markets. However, is this cost of safety too high?
- Instead of stocks, are bonds overvalued in light of where we are in the economic cycle?
- Is “safe” more risky than many believe? Is “risky” more safe than many fear?
We seek to answer these questions by examining stock and bond valuations in more detail and in the context of our assessment of economic conditions.
Stock Valuations in a Historical Context
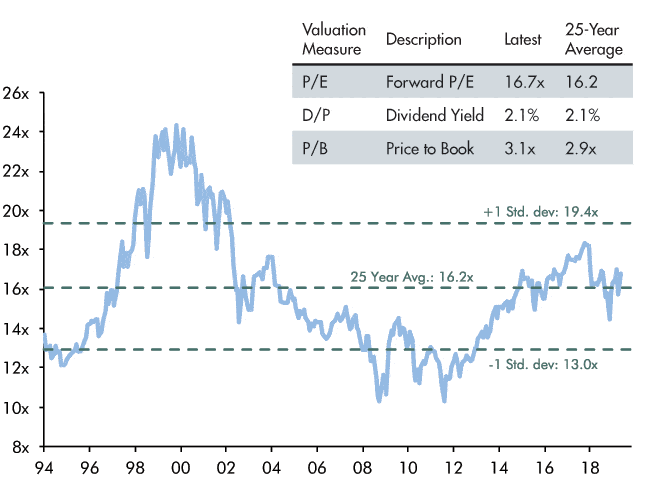
As of June 30, 2019, the S&P 500 index was trading at a forward P/E multiple of 16.7 times and a trailing P/E of 20.6 times. Concerns about stock valuations stem from the fact that these P/E ratios are higher than those observed on average over the long history of several decades.
It may be worthwhile to observe valuations across changing economic regimes. As an example, the duration of economic cycles, the effectiveness of monetary policy and catalysts for inflation may all evolve over time as the economy adapts to changing growth dynamics. In this setting, we look at today’s valuations relative to the most recent 25-year history in Figure 1.
Figure 1: S&P 500 Forward P/E Ratio

Figure 1 shows the current forward P/E is close to the recent average despite some significant fluctuations over this time period. The inset in Figure 1 compares other valuation metrics to their recent averages.
The Dividend Yield and the Price to Book, P/B, ratio are valuation metrics that compare market prices to dividends and book value respectively. Similar to the P/E ratio, the dividend yield and P/B ratio are in line or slightly above their 25-year averages.
The range of P/E ratios in Figure 1 was observed during the long secular bull market in bonds when interest rates were low and declining. We believe that inflation is likely to remain low in the foreseeable future as technology and competition keep a lid on prices. Interest rates are also likely to remain low because of both lower inflation and slower growth.
We build on this theme of slow growth, low inflation and low interest rates and their impact on stock valuations in the next section.
Stock Valuations and Fundamental Drivers
The current economic expansion is now the longest on record and has been characterized by slower growth than in previous cycles. The recovery from the Global Financial Crisis has been muted for several reasons, ranging from the powerful forces of deleveraging to the constant stream of geopolitical setbacks.
The main upside to this trend of below-average-growth is that it is likely to prevent the economy from overheating and unleashing inflationary pressures. Most cycles end from excessive monetary tightening and that risk is significantly mitigated this time around.
We have written extensively that a recession in the near term is less likely given the underlying strength of the US consumer. As a result, we do not see a high probability of an earnings collapse and a compression of the P/E ratio related to earnings.
Barring a recession, low inflation and low interest rates actually bode well for stock valuations. The price of a stock discounts future cash flows by prevailing risk- adjusted interest rates. It then stands to reason that low interest rates are supportive of higher stock valuations.
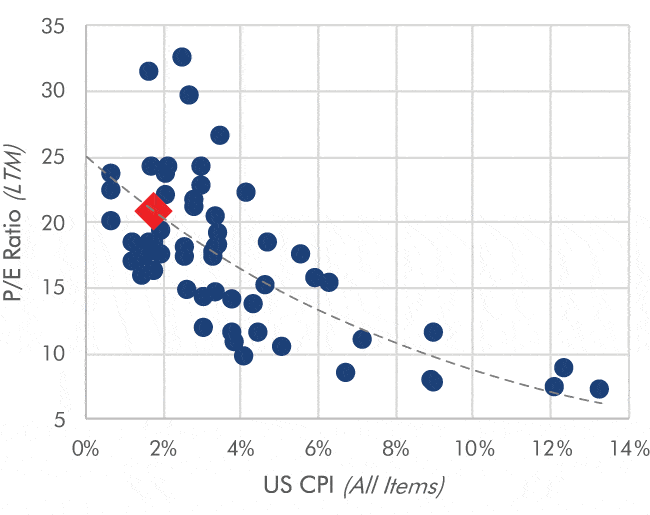
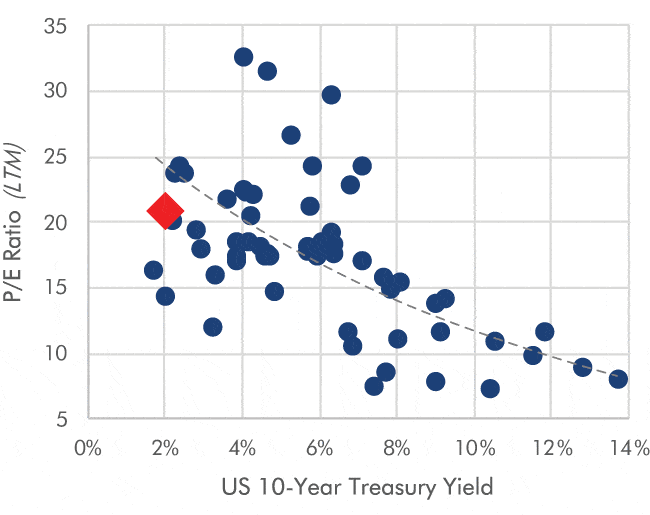
We show this relationship between stock P/E ratios and inflation and interest rates in Figures 2 and 3 respectively.
Figure 2: P/E Ratios and Inflation

Figure 3: P/E Ratios and Interest Rates

These charts highlight the following key observations.
- P/E ratios are inversely correlated to inflation and interest rates. Lower inflation and lower interest rates support higher P/E ratios.
- The relationship is not linear. P/E ratios rise (fall) more steeply as inflation and interest rates fall (rise).
- We believe that US inflation and interest rates are likely to be bound in the 2-3% range in the foreseeable future. We expect that this regime of lower-than-average inflation and interest rates will support a higher-than- average P/E ratio in this foreseeable future.
- Absent a recession, stocks appear to be undervalued relative to prevailing and foreseeable interest rate regimes.
We close out our discussion on stock valuations with another favorable comparison of stocks to bonds. The forward P/E of 16.7 times on the S&P 500 can be inverted to measure an earnings yield, E/P, of 6.0%. This yield from stock earnings compares favorably with the 10-year Treasury bond yield of just 2%. The valuation spread between the earnings yield and the bond yield (6% minus 2%) is wider than average which makes stocks more attractively valued than bonds.
Bond Valuations are Stretched
We look at a conventional valuation metric to assess just how expensive the global bond markets are. Long- term bonds typically offer a premium over inflation as compensation for the risk of investing over a long horizon and bearing interest rate fluctuations in the interim. The spread between the nominal interest rate and inflation is referred to as the real yield for bonds. A high level of real yields makes bonds cheap and attractive; low real yields make bonds expensive and unattractive.
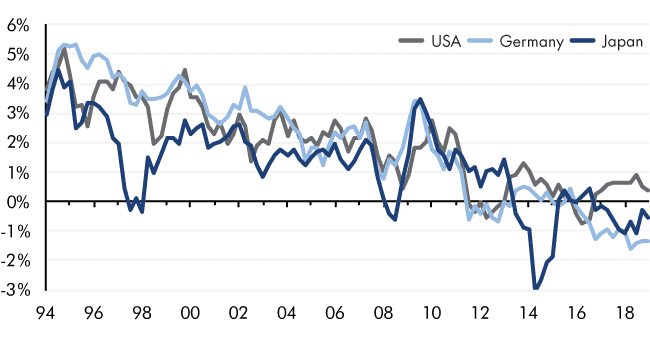
Figure 4: Real Government Yields Over Time

Figure 4 shows how real yields for US, Japanese and German 10-year bonds have changed over the last 25 years.
We can see that real bond yields have declined steadily and are now close to zero for US bonds and negative for Japanese and German bonds. The inability of global 10-year bonds to even match inflation represents a poor level of future returns stemming from high current prices.
We believe a number of factors contribute to these high bond valuations. Central banks outside the US are still engaged in quantitative easing which results in higher prices from prescribed bond purchases. A smoother economic cycle and lower and more predictable inflation play a role in higher bond prices as well. We also believe that investors who crave safety in the midst of uncertainty have bid bond prices higher as they seek a safe haven.
As we can see in Figure 4, current real bond yields are extremely low. We estimate the global bond markets are overvalued by more than 1 standard deviation relative to their historical norm. As an additional nuance, they are also more vulnerable to rising interest rates today than under normal conditions.
We believe bonds are more expensive than stocks on both an independent and relative basis.
Summary
The stock market rally in 2019 so far is indicative of a stable economic environment in the months ahead. The decline in global bond yields suggests the opposite. While time will tell for sure, we feel that stock market valuations are more reflective of likely economic outcomes. We believe that the odds of a recession in the near term are low and, therefore, stock valuations are less vulnerable to a significant decline in earnings.
A high level of risk aversion among investors has increased the cost of safety as reflected by high bond market valuations. In a curious twist, the resulting low bond yields are actually supportive of current stock valuations.
We believe stocks offer more value than bonds at this point and maintain an overweight to stocks in our asset allocation. We acknowledge that the cycle is extended and geopolitical risks abound. We are, therefore, even more vigilant and selective in our pursuit of high quality companies with stable growth prospects.
“Are stocks overvalued in light of where we are in the economic cycle? Or are bonds overvalued?”
“Barring a recession, low inflation and low interest rates bode well for stock valuations.”
From Investments to Family Office to Trustee Services and more, we are your single-source solution.

