A Growth Scare ... And Likely No Worse
The momentum from two years of remarkable economic resilience and strong market returns came to an abrupt halt in April 2025. The catalyst for market turmoil this time around was an unexpected turn in the administration’s global trade policy.
April 2, 2025 was touted as Liberation Day in anticipation of the long-awaited details on President Trump’s reciprocal tariff policy. The President used his executive authority to address the lack of reciprocity in U.S. bilateral trade relationships and to “level the playing field for American workers and manufacturers, re-shore American jobs, expand our domestic manufacturing base, and ensure our defense-industrial base is not dependent on foreign adversaries—all leading to stronger economic and national security” (Office of the United States Trade Representative).
However, the scope and magnitude of the proposed tariffs exceeded all expectations. In the initial Liberation Day proposal, all countries were subject to a minimum tariff rate of 10%. Countries with whom the U.S. has a large trade deficit were subject to even higher reciprocal tariffs.
The immediate reaction to the announcement was an immense fear of a global recession and a spike in inflation. Consistent with these fears, stocks sold off dramatically after the initial announcement. A temporary pause in reciprocal tariffs for all countries except China then halted the stock market decline. However, the U.S. dollar and bond market both fell sharply and unexpectedly during the week of April 7, 2025 in contrast to their conventional safe haven status.
We address concerns about higher inflation, higher rates, a recession, a bear market, and a weaker U.S. dollar in this article.
We are aware that this is a highly charged and contentious topic. We will, therefore, refrain from any ideological, philosophical, political, or moral judgment on the subject. We also realize that public disclosures on the topic may lack full transparency for reasons of national security. In a rapidly changing world, our views here have been penned in mid-April 2025.
How Did We Get Here?
The original impetus for higher tariffs is likely rooted in the fact that almost all of our trading partners charge a higher tariff on our exports to them than we do on their exports to us. For example, 2023 World Trade Organization data estimates that China, India and the UK have tariff rates of around 17%, 12% and 5% respectively on U.S. exports to them. In contrast, our corresponding tariffs on their exports to us are around 10%, 2% and 2% respectively. This mismatch in tariffs is probably further exacerbated by other unfair trade practices such as non-tariff barriers and currency manipulation.
The administration’s policy on tariffs may have been further emboldened by the perceived leverage of the U.S. over many of its trading partners. Figure 1 shows how this leverage is achieved. It compares the importance of a country’s imports to us (x-axis) versus the importance of U.S. exports to its own global trade (y-axis).
Figure 1: Leverage in Trade Relationships
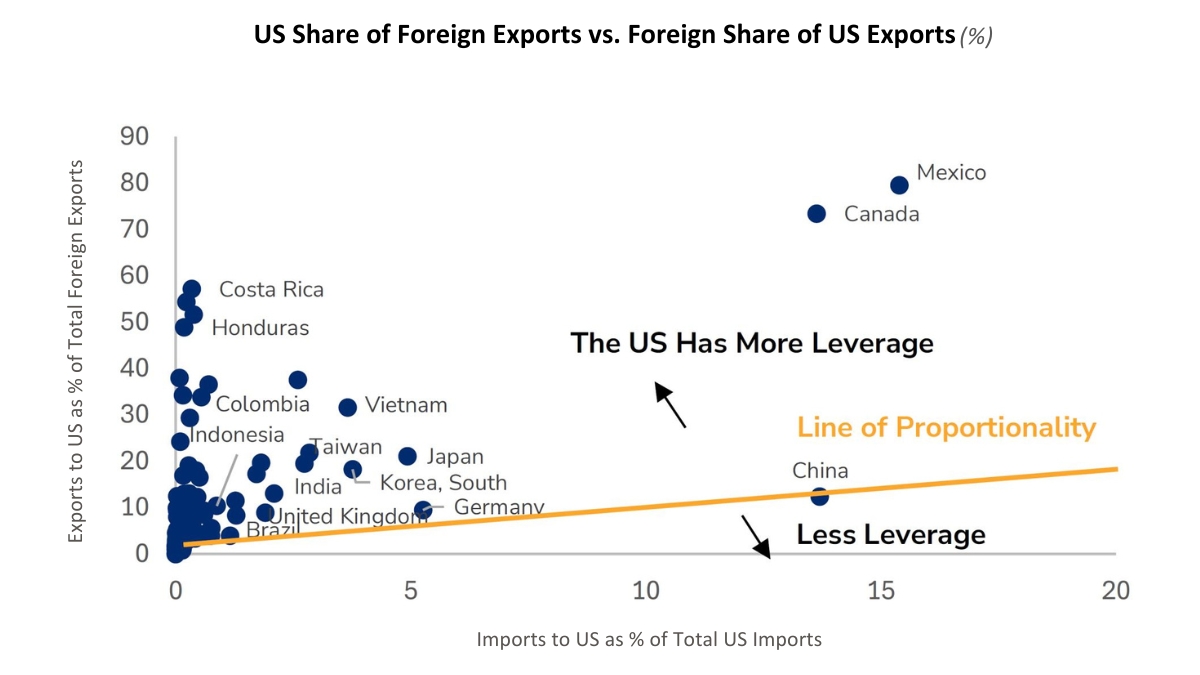
Source: Wolfe Research, World Integrated Trade Solution as of 2022
This chart helps us understand where the U.S. has more leverage with its trading partners. We explain Figure 1 with an example. Take Vietnam for instance. All imports to the U.S. from Vietnam account for only around 4% of total U.S. imports. However, those same Vietnam exports to the U.S. account for almost 32% of its total exports. In light of this imbalance, Vietnam is far more likely to negotiate than retaliate.
In Figure 1, it is clear that Mexico, Canada and several Emerging Markets countries in Asia and South America are most dependent on trade with the U.S., while countries in the EU have more equal trading relationships. China has the most trading leverage against the U.S.; its retaliation has, therefore, been fast and furious.
These salient data points had already been priced into expectations of a higher tariff rate of around 8% prior to Liberation Day. Nonetheless, markets were caught off guard on April 2nd at two levels—by the methodology of tariff calculations and the resulting magnitude of reciprocal tariffs.
Contrary to expectations of a more targeted approach, the reciprocal tariffs were derived from a rudimentary framework that aimed to reduce bilateral trade deficits. Each country’s tariff rate was determined by dividing the U.S. trade deficit with that country by total imports from that country. This number was then cut in half to create the new U.S. “discounted” reciprocal tariff. Here are some of the initial proposed reciprocal tariffs from Liberation Day: China 34%, EU 20%, Japan 24%, India 26%, Vietnam 46%, Switzerland 31% and UK 10%.
These initial reciprocal tariffs have since been suspended for 90 days for all countries except China from April 10th. In sharp contrast, tariffs with China have escalated exponentially through a sequence of retaliations; they now stand at 145% on Chinese exports to the U.S. and 125% on U.S. exports to China. U.S. tariffs on all other countries temporarily stand at the minimum baseline of 10%.
We summarize the revised April 10th levels of tariffs in Figure 2 before turning to our inferences and forecasts.
Figure 2: Average Effective Tariff Rate as of April 10, 2025
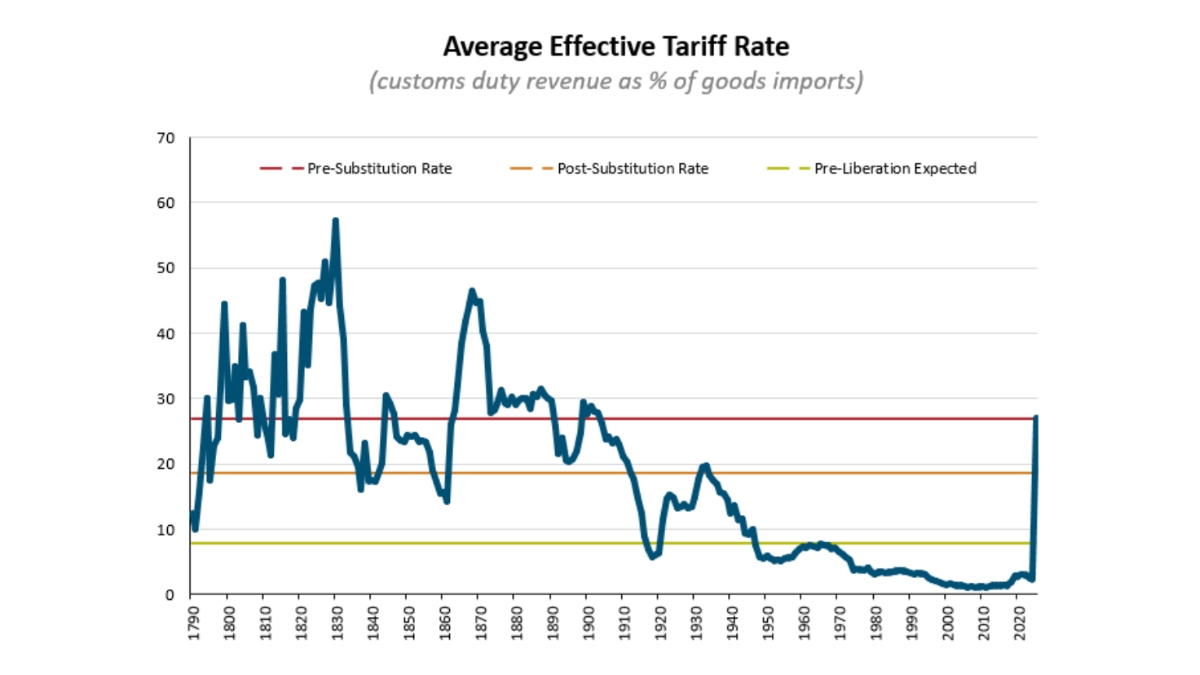
Source: The Budget Lab, Yale University
The average global tariff rate for the U.S. is now projected to go up more than 10-fold from 2.4% to approximately 27%. We label this average tariff rate as a “pre substitution” rate since it assumes that all flows of global trade remain constant and intact at 2024 levels. However, higher tariffs on Chinese goods may well trigger substitution to other cheaper imports. The resulting “post substitution” average tariff rate is lower and estimated to be 19%.
Thoughts on Current Trade Policy
We appreciate the desire to increase the U.S. manufacturing base and reduce foreign dependencies in industries critical to national security. We also applaud the pursuit of fairer terms for global trade.
Nonetheless, we initially believed that it was sub-optimal to achieve these goals with an aggressive trade policy alone. A number of tenets in the opening approach seemed misaligned with our global leadership role, created by our own dominant economy and strong alliances with others.
The costs of high fixed trade barriers are well-known, e.g. higher prices, slower growth, less competition, less innovation, and lower standard of living. The expansive and punitive trade war in its initial formulation on April 2nd risked a U.S. recession and an alienation of our allies.
The singular focus on reducing bilateral trade deficits through high imputed tariffs also felt misguided. A large portion of the U.S. trade deficit is driven by principles of comparative advantage where cost of production is often lower overseas and by cultural differences in our lower propensity to save and greater desire to consume. Besides, the large foreign trade surpluses eventually make their way back into U.S. dollar-denominated assets giving our stocks, bonds and currency hegemonic power.
These thoughts may also have preyed on investors’ minds as they indiscriminately sold risk assets. The S&P 500 suffered a 2-day decline of -10.5% on April 3rd and 4th. It was remarkably the first ever decline of such magnitude to be triggered by a policy initiative during benign times – as opposed to an existing endogenous fundamental crisis (e.g. Global Financial Crisis) or an unexpected exogenous shock (e.g. Covid).
Two recent developments have opened up a different possibility for the intent and scope of the current trade war: 1) The U.S. has rapidly escalated tariffs against China all the way up to 145% and 2) The U.S. has rapidly deescalated tariffs on all other countries down to 10% for 90 days. There may now be some credence to a scenario where the trade war is focused on curtailing China’s economic, manufacturing, scientific, technological, and military might while actually strengthening all other global alliances through reconciliation, collaboration and some coercion.
Future Evolution of Trade Policy
We have maintained since the elections that the bark of proposed tariffs will eventually be bigger than its final bite. We have been clearly surprised by the much louder bark and greater magnitude of the new reciprocal tariffs and the damage they have inflicted on the markets so far. Nonetheless, we still believe they will eventually be implemented at lower levels than the ones proposed on April 2nd.
Excluding China, we reckon that global tariffs will settle in at the 8-18% level. While an extensive and protracted global trade war remains a possibility, it is not our base case.
It would serve both the U.S. and China well to find an off ramp towards a more stable co-existence as the world’s two leading economies. If that doesn’t happen for any reason, it is conceivable that the U.S. may largely shift its trade dependence on China to other countries. As supply chains re-adjust, we expect the tariff shock to fade and be subsumed by the positive fundamentals of higher productivity growth, fiscal stimulus and deregulation.
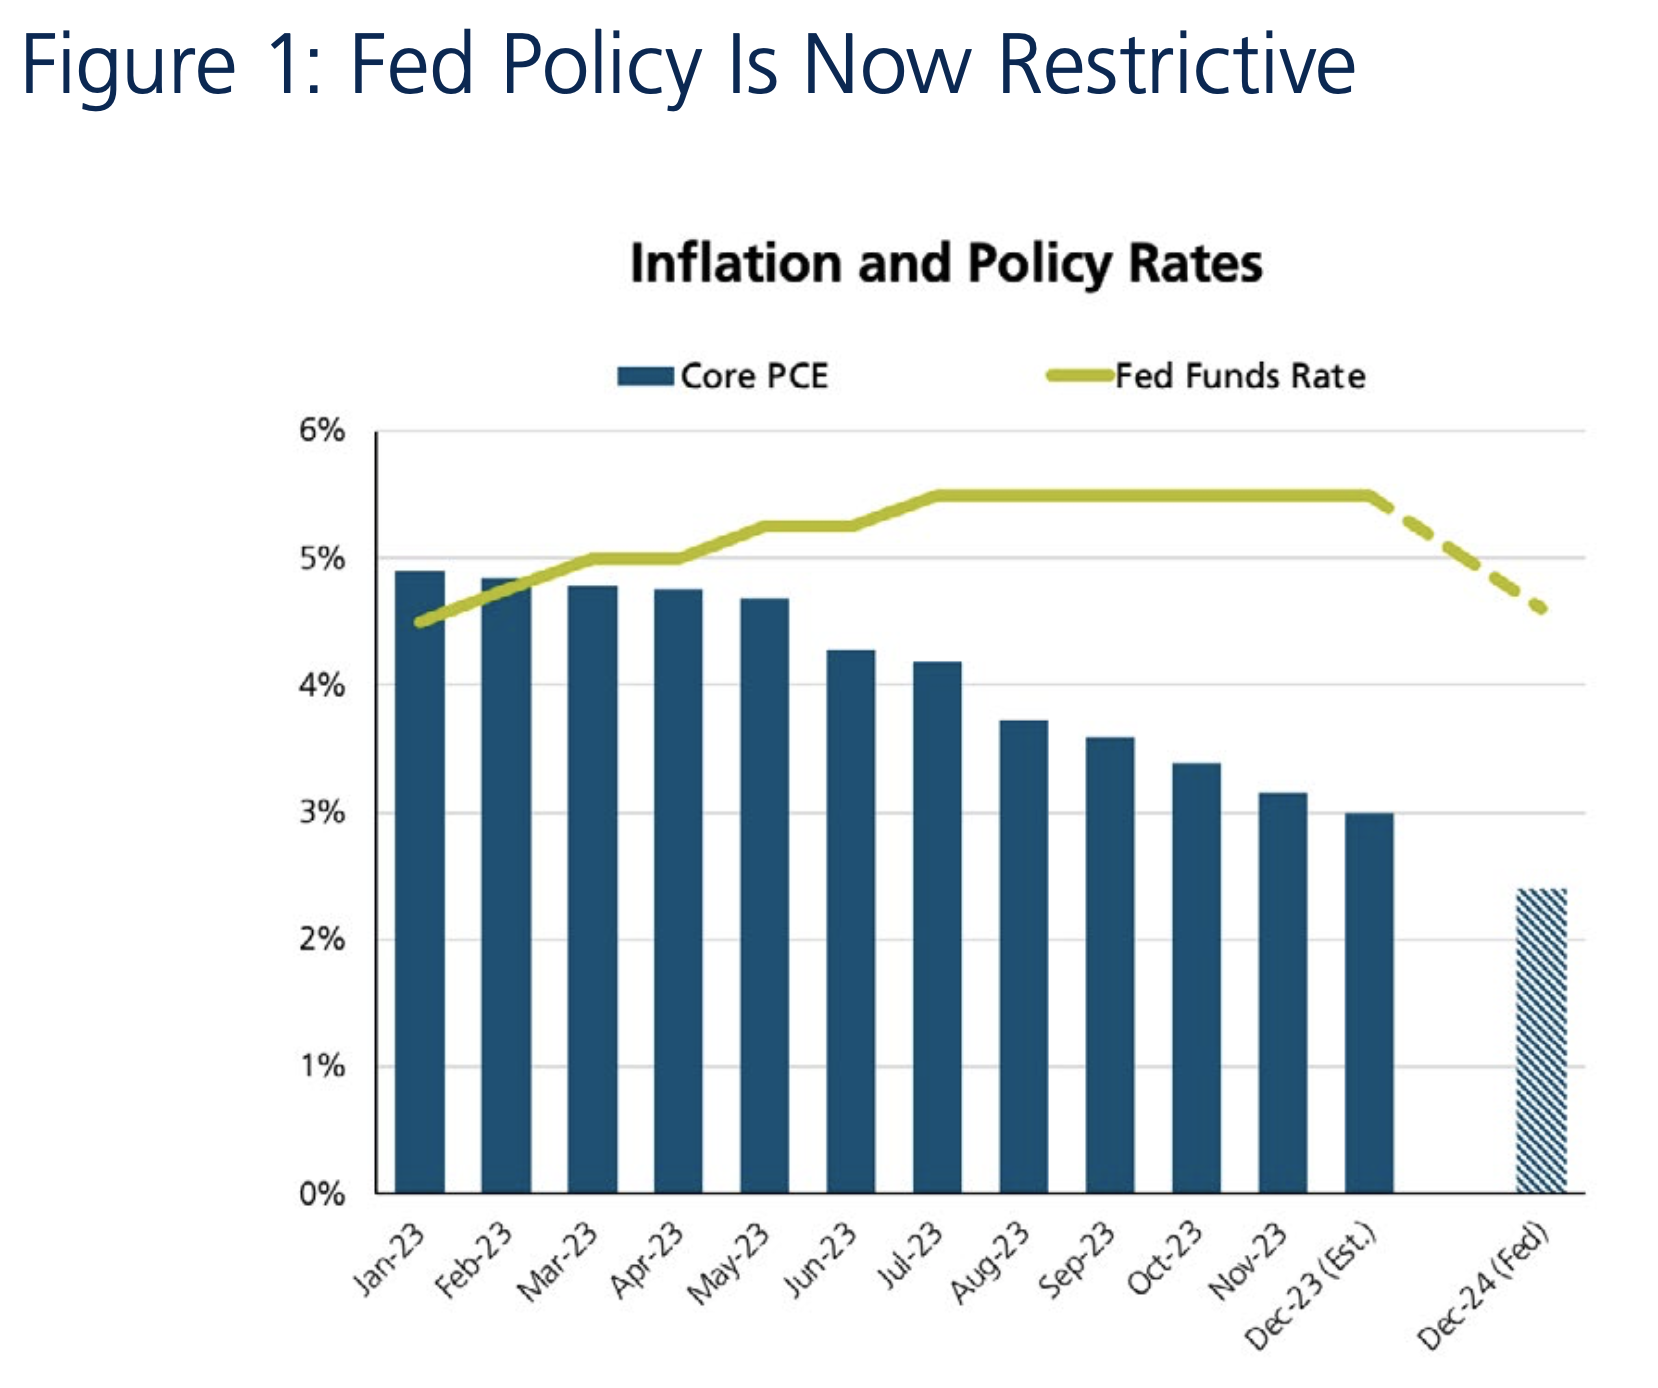
Impact on the Economy
The direct impact of higher tariffs is clearly inflationary and recessionary. We also understand that high levels of policy uncertainty can take an indirect economic toll from reduced consumer spending, slower hiring and lower capital expenditures.
Since higher prices are tantamount to a tax on households, we begin by estimating the impact of tariffs on disposable incomes. Figure 3 shows the likely impact of the April 10 package of tariffs on disposable incomes across different deciles of household incomes.
Figure 3: Impact of Tariffs on Disposable Income
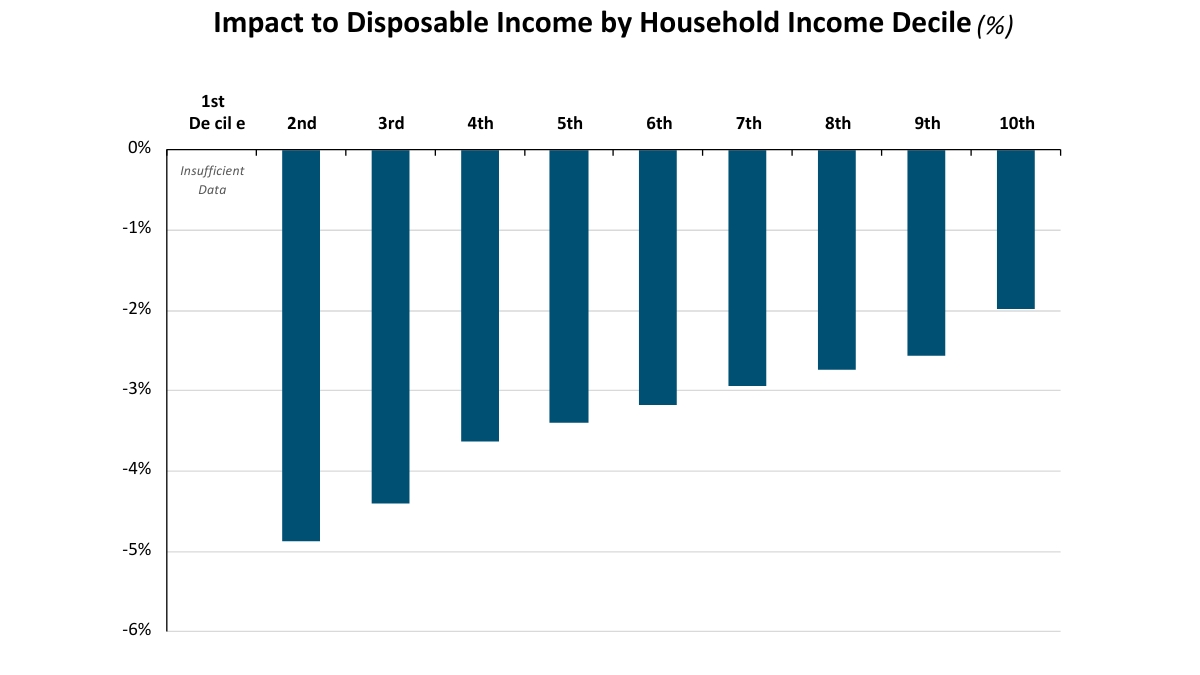
Source: The Budget Lab, Yale University
The top 10% of households by income (highest decile #10) in Figure 3 is expected to see the smallest disposable income decline of -2%. On the other hand, the lowest decile of household income may see disposable income fall by almost -5%.
Any reduction in consumer spending from a decline in disposable income will likely be uneven and disproportionate across income categories. A -2% decline in disposable income for the highest income households may have virtually no effect on their spending. Since most of the aggregate consumer spending takes place in high income households, we are optimistic about a relatively muted impact of tariffs on growth.
We expect up to a -1% direct impact of tariffs on GDP growth and up to a -0.5% indirect impact. Therefore, we expect GDP growth to be reduced by -1% to -1.5% in 2025. From a strong starting point of 2.5% real GDP growth, we expect 2025 growth will still be above zero even after our anticipated reduction.
While the odds of a recession or “stagflation” have gone up, neither scenario is our base case. We estimate the odds of a recession to be 30%, which is well below the consensus expectation of 60-70%.
It is evident that inflation will likely be higher in 2025, but we expect it to subside in 2026 as the world adjusts to a new global trade order. On a positive note, we observe that inflation expectations for a 5-year period starting in 2030 have actually declined from 2.3% to 2.1% as of April 11, 2025. We believe current Treasury bond prices are overestimating long-term inflation risks.
Impact on the Markets
U.S. Stocks
The U.S. stock market has seen some wild swings in 2025. Here is the most striking statistic we have found on recent stock market volatility: If you add up all the absolute intra day moves of 3% or more in the 3 trading days between April 7th and April 9th, the S&P moved a monumental 52%!
In the midst of such high volatility and uncertainty, it is difficult to form an outlook for U.S. stocks. We give the task at hand our best analytical effort and intuitive judgment by forecasting both expected S&P 500 earnings and P/E multiples.
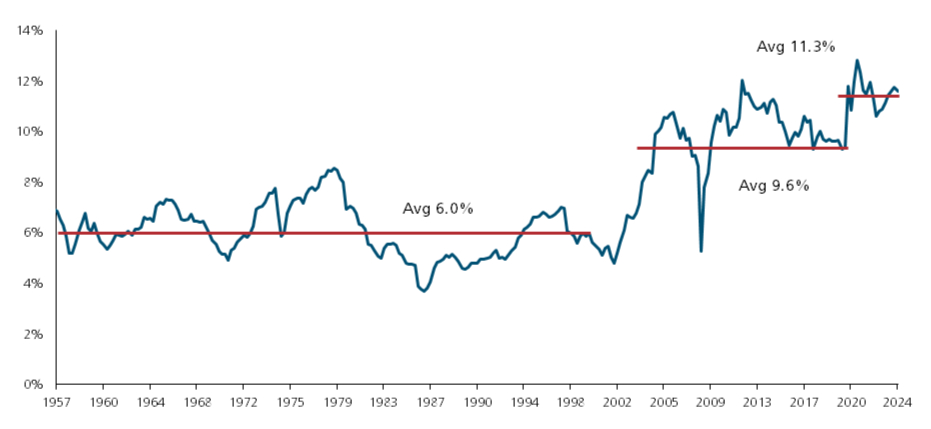
We have observed over the years that earnings growth for the S&P 500 tends to be 3-4 times U.S. GDP growth. Based on our view above that GDP growth may be lower by -1% to -1.5%, we expect S&P 500 earnings growth may also be lower by around -4% to -5%. Despite a reduction in the earnings growth rate because of tariffs, earnings will still rise in the next 12 months.
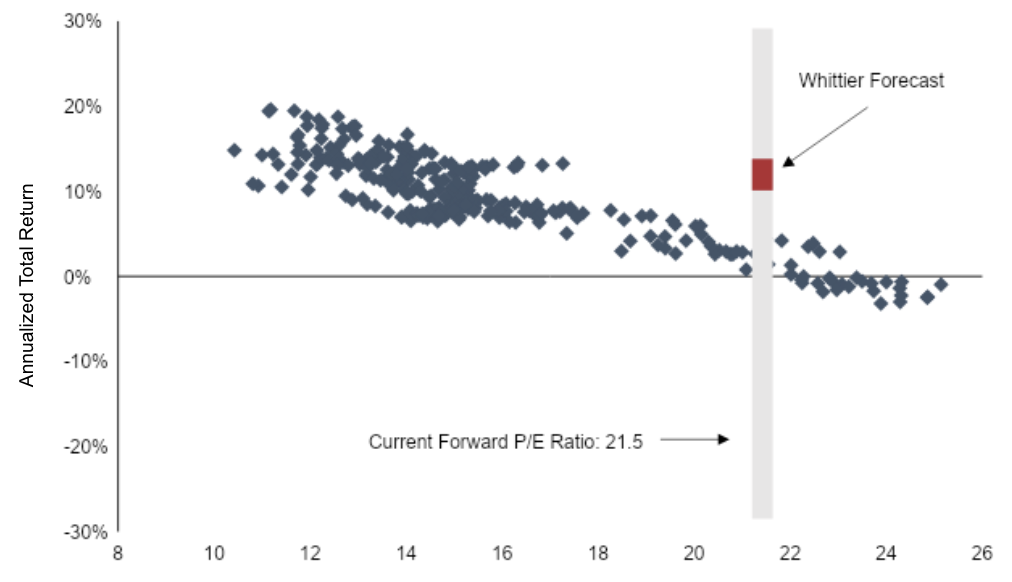
We have a more differentiated view on where trough multiples will likely end up. In prior recessions, they have fallen to as low as 10-13x. In non-recessionary growth scares, they have fallen to 15-16x.
We believe trough multiples will be higher during this growth scare. The current economic and market crisis is policy-induced; up to a certain point, the antidote for the crisis also remains in the hands of policymakers. And as a beacon of hope and optimism, we already have light at the end of the tariff tunnel in the form of fiscal stimulus and deregulation. Therefore, we strongly believe the trough P/E multiple will be higher this time at about 18x.
We also know that trough earnings and trough P/E multiples are never coincident; you cannot see them simultaneously. You typically see trough prices first, then trough multiples and finally trough earnings.
With these building blocks in hand, we estimate that a viable floor for the S&P 500 may exist at the 4,900-5,000 level. While we obviously cannot rule out lower prices, we may just about avoid a bear market by remaining above its closing price threshold of 4,915.
Our base case rules out a bear market, expects the current correction will not be protracted and predicts the S&P 500 will deliver a positive return in 2025.
U.S. Bonds and Dollar
The manic turmoil in the U.S. bond and currency markets during the week of April 7th could well be the topic of an entire article. We confine ourselves to a few key observations here.
Treasury bond prices and the U.S. dollar both fell significantly in the second week of April. This is an extremely rare occurrence, and it triggered profound fears that we were at the beginning of the end of U.S dominance in global bond and currency markets. Critics attributed the selloff to fundamental factors ranging from heightened U.S. fiscal risks caused by an imminent recession to a devastating loss of confidence in U.S. institutions and leadership.
We do not believe those factors were central to the meltdown in U.S. bonds and the dollar. Instead, we believe it originated from a more nuanced and niche event in the bond market. It is widely understood that hedge funds were unwinding a very large and highly leveraged “bond basis” trade in the face of low liquidity and high volatility. This forced and rapid liquidation created significant price dislocations in both Treasury bonds and the U.S. dollar.
We expect U.S. Treasury bonds and the dollar to stabilize in the coming weeks. We believe the 10-year Treasury yield should be closer to 4.1-4.2% in the near term and around 4.5-4.6% in the long run.
Summary
We close out our discussion on a positive and optimistic note.
We know from prior experience that high levels of consumer pessimism, policy uncertainty and fear gauges tend to be contrarian in nature. In other words, stock market returns in the aftermath of high pessimism or fear have historically been high. Figure 4 shows the contrarian nature of consumer sentiment.
Figure 4: Consumer Sentiment is Contrarian
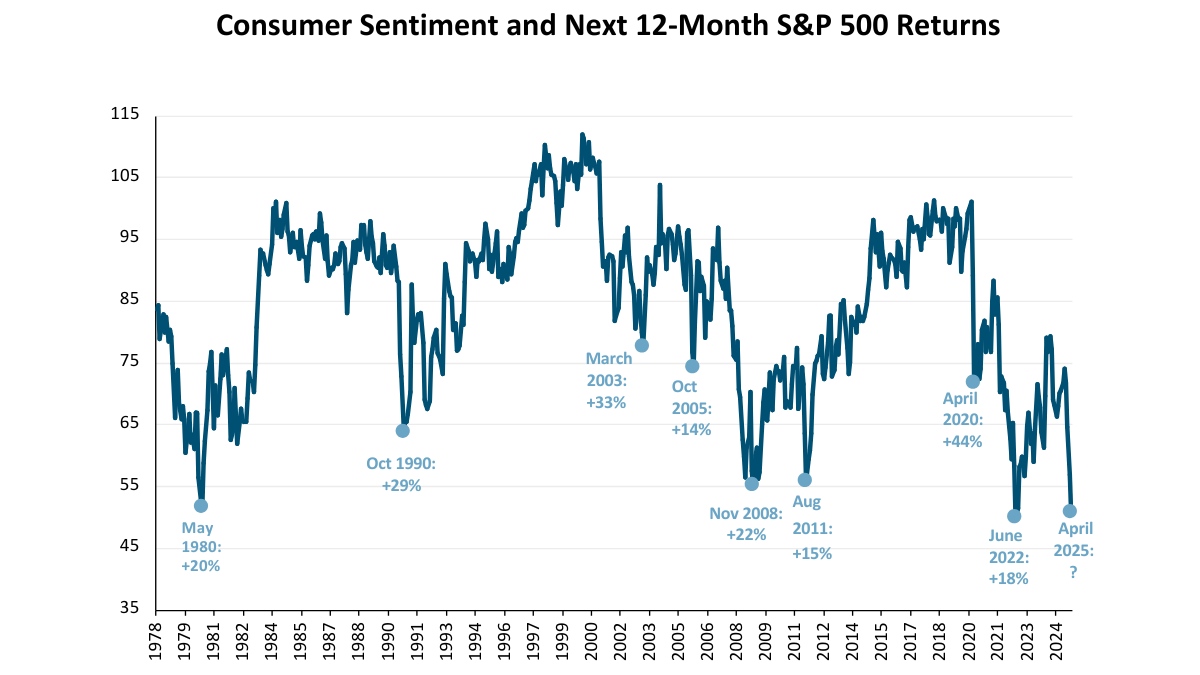
Source: University of Michigan, JPMAM, as of April 2025
The latest reading of consumer sentiment nearly reached its all-time low mark of 50.0 on April 11, 2025. While it accurately reflects coincident pain in the economy, it sadly lags the direction of future stock prices.
The stock market tends to look 9-12 months ahead and generally bottoms out when things are at their worst and about to get better. If history is any indication, stock returns over the next 12 months may be handily positive.
We summarize our key takeaways below.
- We believe final tariffs will be lower than those proposed currently; their impact on inflation, GDP growth and corporate profits will also be lower than currently feared.
- We assign a low probability to a recession, “stagflation” or a bear market.
- We do not anticipate a protracted correction in stock prices; we expect the S&P 500 to deliver a positive return in 2025.
- We believe fears of “de-dollarization” and significantly higher Treasury yields are overblown; we expect the bond market and the U.S. dollar to halt their declines in the coming weeks.
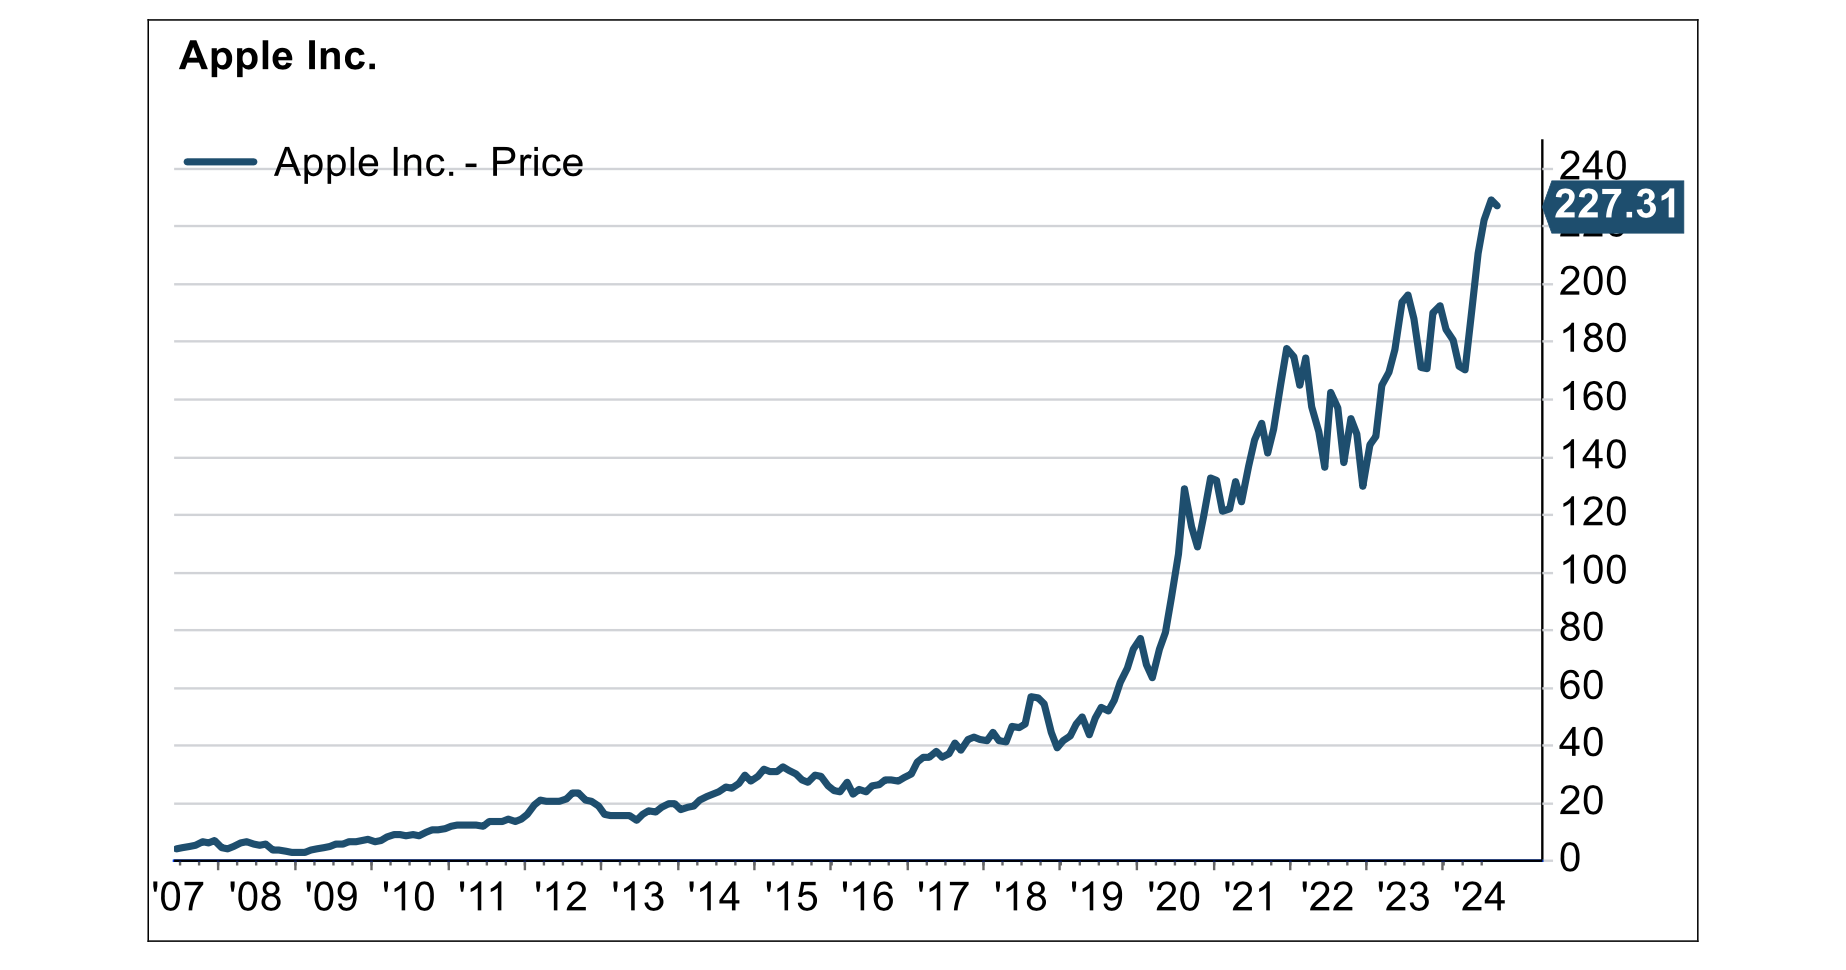
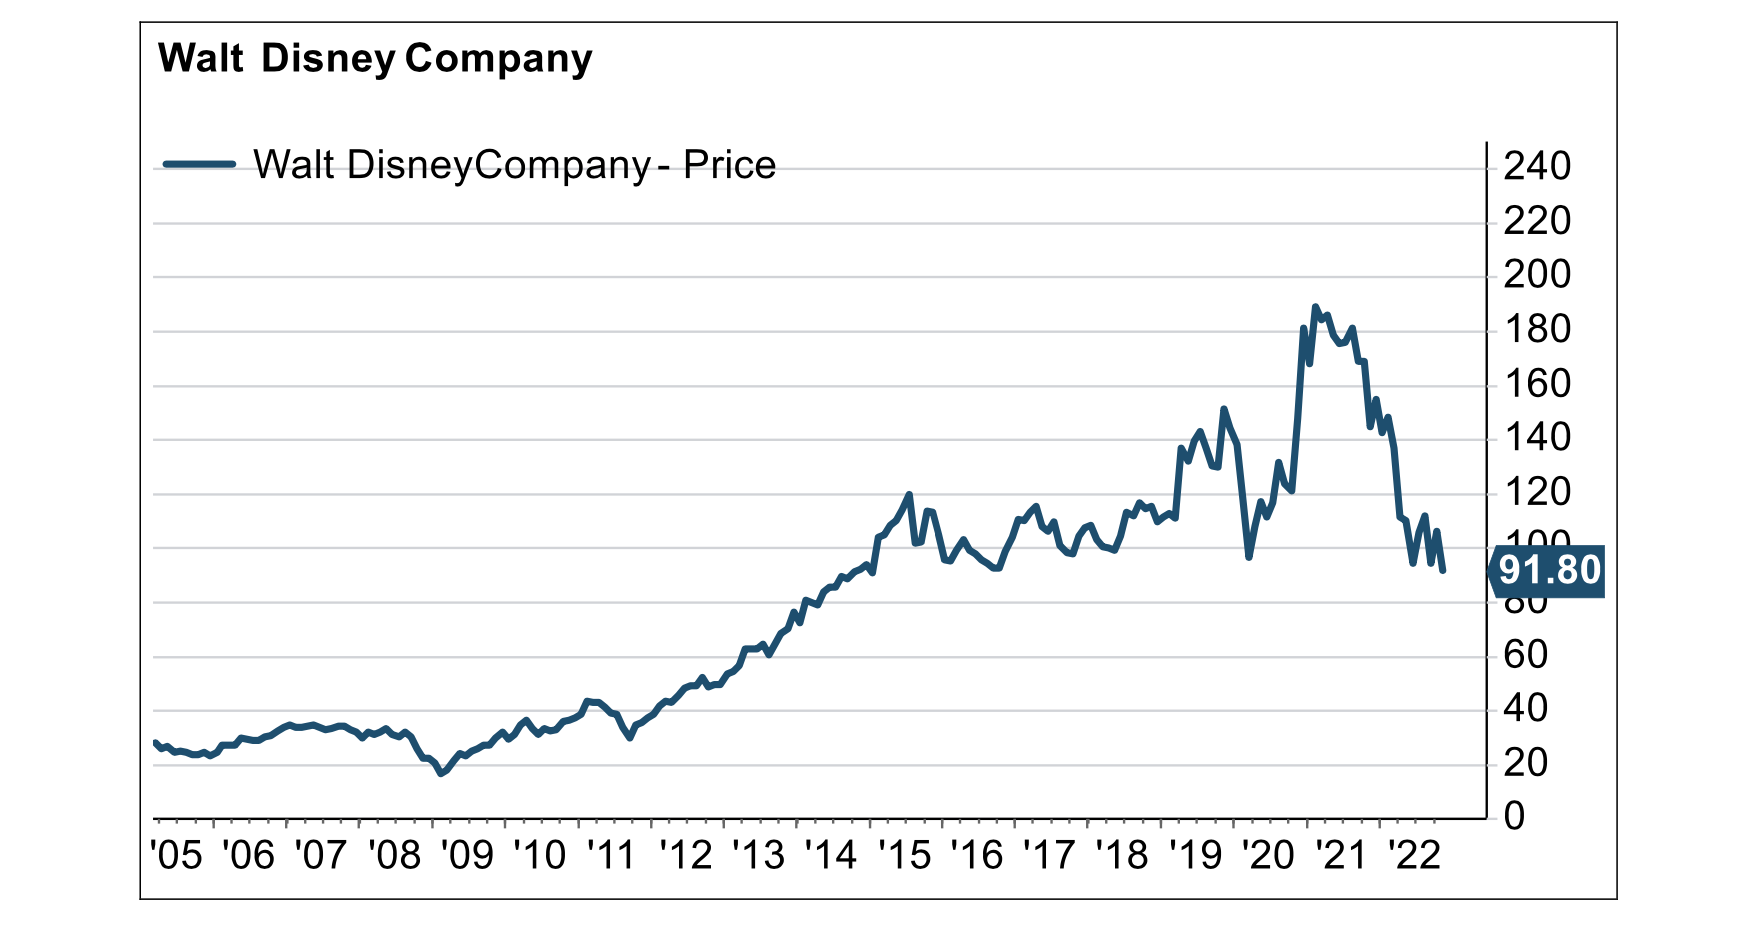
Within client portfolios, we are focused on adding to or buying new high quality securities that have sold off disproportionately in this “tariff turmoil”. In these uncertain times, we remain careful, prudent, disciplined, and prepared to act on emerging opportunities.
To learn more about our views on the market or to speak with an advisor about our services, visit our Contact Page.
We believe final tariffs will be lower than those proposed currently; their impact on growth and inflation will be lower than feared.
We assign a low probability to a recession, “stagflation” or a bear market.
We expect the S&P 500 to deliver a positive return in 2025.
We believe fears of “de-dollarization” and significantly higher Treasury yields are overblown.
From Investments to Family Office to Trustee Services and more, we are your single-source solution.


 Source: FactSet
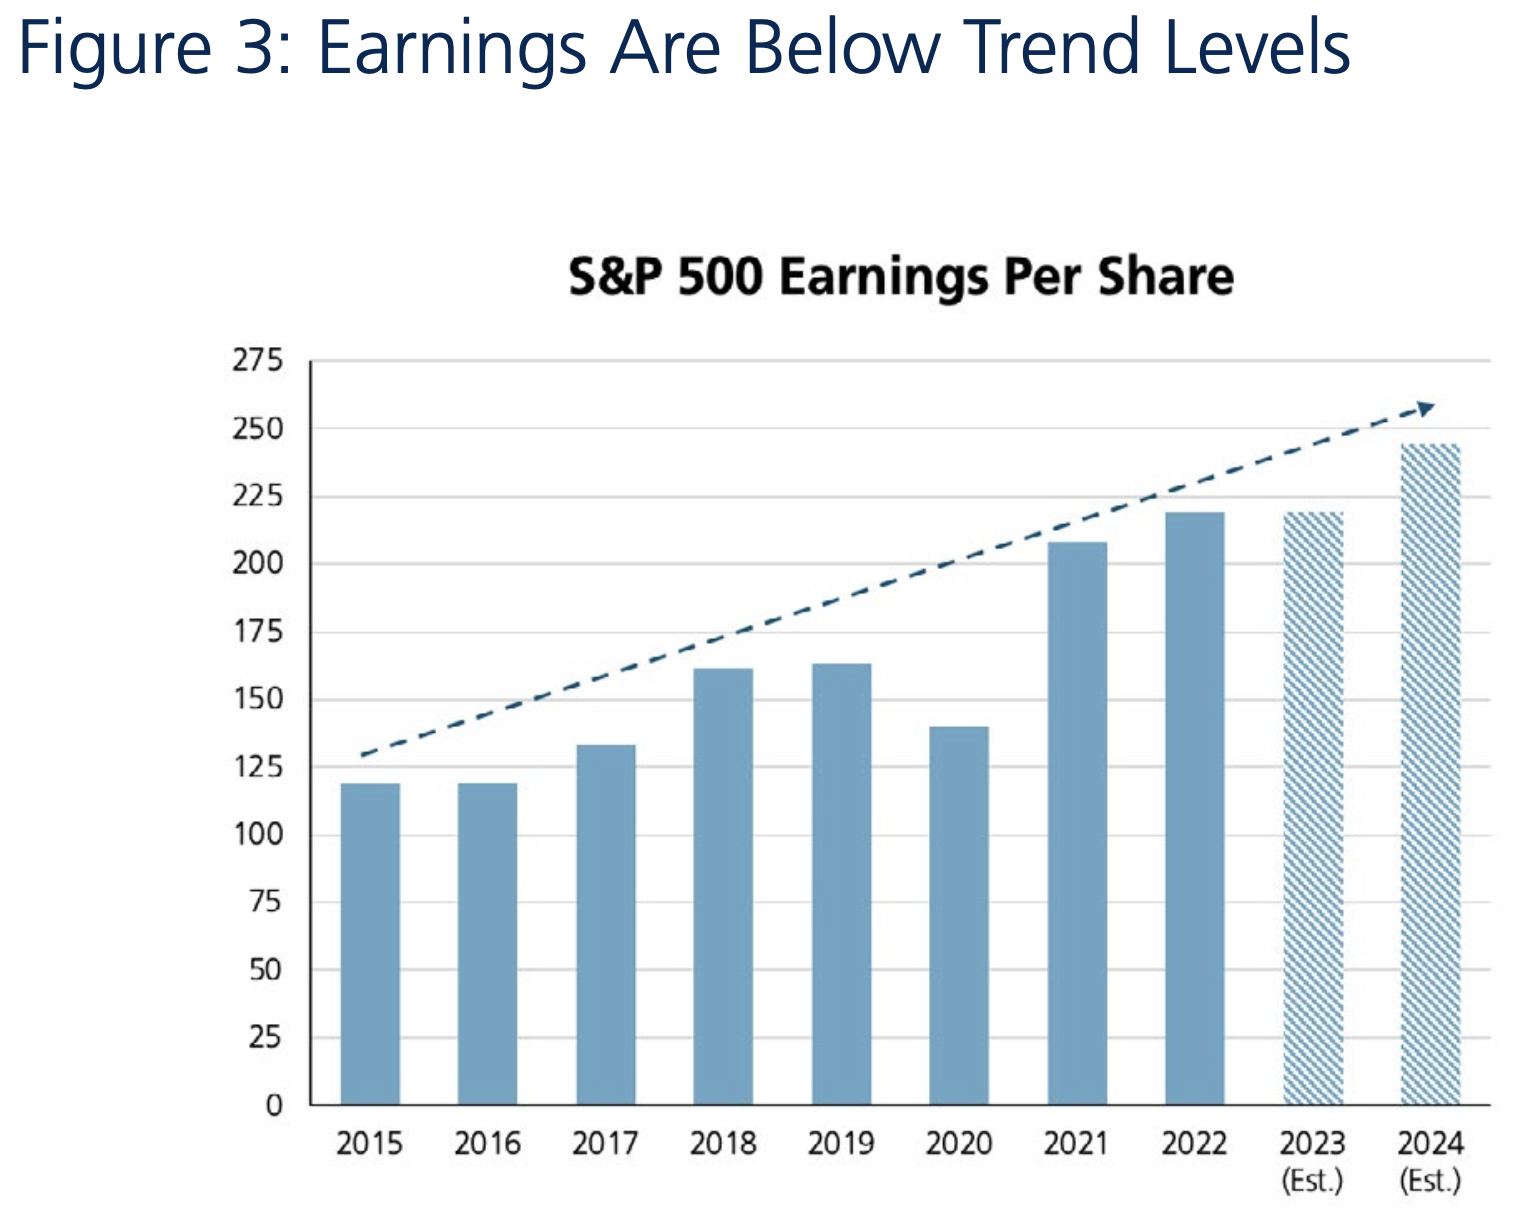
 Source: Factset
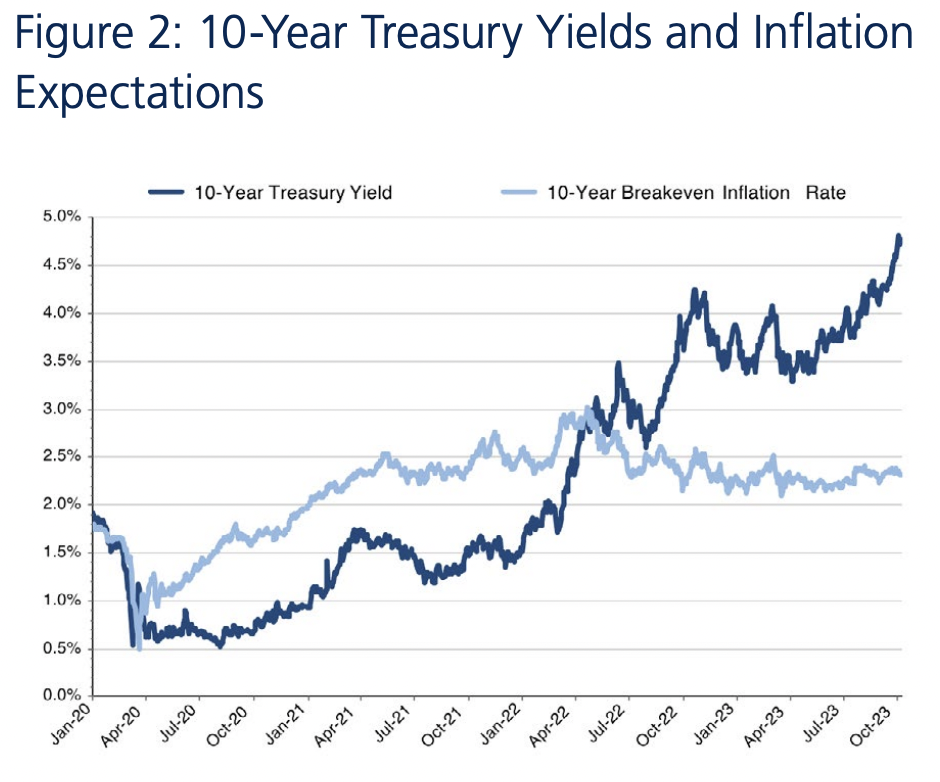 Source: Factset