Watch this video of Sandip Bhagat, our Chief Investment Officer, discussing the latest market insights.
Relative Value... Opportunities or Mirages?
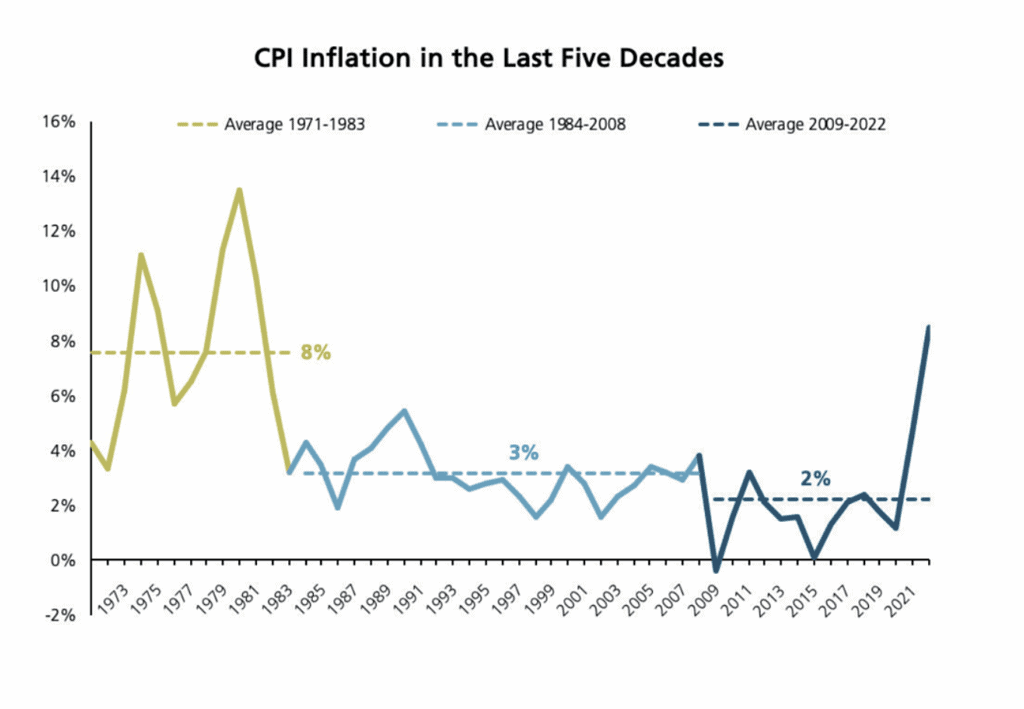
The dramatic melt-up in stock prices during the fourth quarter of 2023 continued into early 2024. Fears of an impending recession continued to recede and economic activity exceeded expectations. Job growth is now down to pre-Covid levels and remains solid. With the Fed firmly on pause after ending rate hikes in 2023, expectations of a pivot to rate cuts took hold during the first quarter.
Stronger-than-expected growth and the potential advent of monetary easing propelled the S&P 500 higher by 10.6% in the first quarter. The Nasdaq 100 rose by 8.5% and the Russell 2000 index of smaller companies gained 5.2%.
The unexpected economic strength was also accompanied by unexpected increases in monthly inflation. Forecasts for the number of Fed rate cuts fluctuated wildly and fell from 7 to 3 by the end of March. Bonds sold off as a result and the 10-year Treasury bond yield rose from 3.9% to 4.2% during the quarter.
Several concerns still linger in investors’ minds. The recent uptick in inflation may halt or reverse the downward trend of disinflation. A higher-for longer restrictive Fed might derail the economy and the stock market. The generally reliable signal from an inverted yield curve is still calling for a recession. And finally, many fear that stock valuations may be dangerously stretched and earnings expectations may be unrealistically lofty.
We addressed these concerns in our 2024 outlook published last quarter. We devote this article to a deeper dive on stock valuations. As investors fret high stock valuations, especially in mega-cap growth companies, they are now searching for more attractive “relative value” opportunities within the global equities universe.
Small cap and international stocks have significantly underperformed in recent years. As a result, their valuations have declined. On a relative basis, their valuation differential to U.S. large cap stocks is now approaching all-time lows.
Figure 1 illustrates the stark valuation differentials between U.S. large (LRG), mid (MID) and small (SML) companies and those in the developed (DEV) and emerging (EM) international markets. We show P/E ratios for each equity index based on 2024 earnings estimates.
Figure 1: P/E Ratios Across Size and Regions 
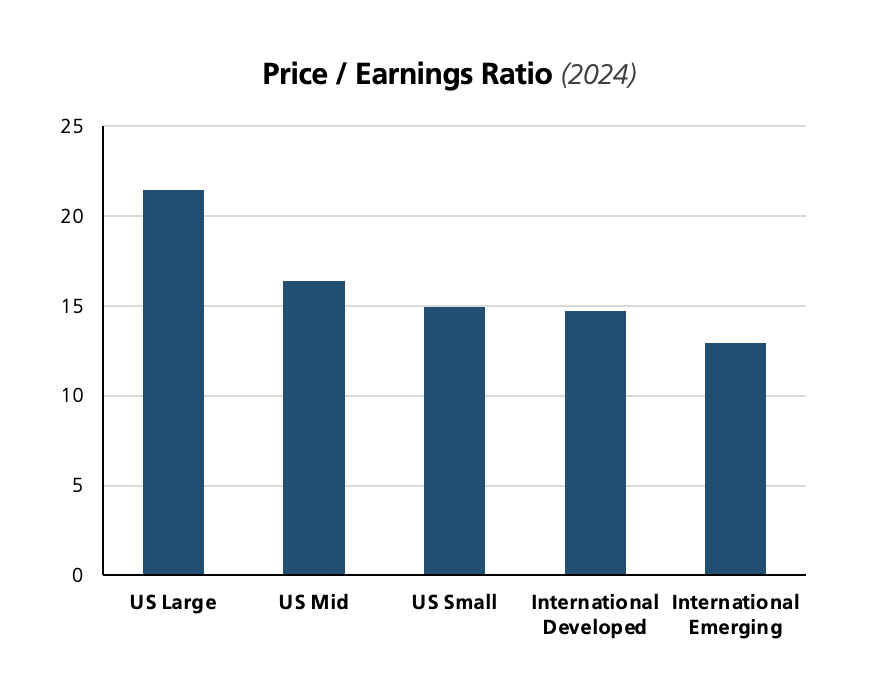
Source: FactSet, US Large: S&P 500 Index, US Mid: S&P 400 Index, US Small: S&P 600 Index, Developed: EFA ETF, Emerging: EEM ETF
A similar valuation dispersion is also observed between value and growth stocks. Value stocks are those that trade at lower P/E multiples; they have underperformed growth stocks by a wide margin in recent years. One of the widely believed stock market anomalies is the propensity of value stocks to outperform growth stocks in the long run.
At this point in the cycle, a big valuation gap is only one of many factors that make small cap, value and international stocks more interesting. Small cap and value stocks usually outperform during a revival of growth after a slowdown. As the prospects of a recession abate, we are conceivably at an inflection point for the resumption of economic growth.
International stocks perform better when the global economy improves and the dollar remains weak or neutral; both of these conditions are likely to prevail in the coming months. And finally, the breadth in the U.S. stock market is remarkably narrow. At the end of March, the top 10 stocks in the S&P 500 index made up an extraordinary 34% of its market capitalization and accounted for 82% of its return in the last 15 months. If breadth expands to more normal levels, value and small cap stocks will most likely benefit.
We recognize these arguments in favor of small cap, value and international stocks. We are even intrigued by their potential to enhance portfolio returns.
But are small cap, value and international stocks truly attractive “mispriced” opportunities, or are they mirages and potential value traps?
We look for important fundamental differences between these equity sub-asset classes which may explain their big valuation differentials. We identify and examine three key differentiators within the equity universe.
- Sector composition
- Growth prospects
- Fundamental quality
We find that there are sufficiently large variations in these fundamental factors to justify the divergence in relative valuations.
We caution, therefore, that “all that glitters may not be gold” in the world of relative valuations. Investors will be better served to look past mirages and avoid value traps where cheap stays cheap or gets even cheaper.
Sector Composition
The U.S. has produced some of the world’s most innovative, successful and dominant companies in recent years. Most of them are either Technology companies or ones whose business model leverages technology in a big way.
On many levels, U.S. large companies exemplify the New Economy where technology lowers costs and increases growth, profits and productivity. Developed international companies lie at the other end of the spectrum. Financials and Industrials dominate the developed international index within a more conventional Old Economy setting.
Figure 2 arrays the sector weights for U.S. large, mid and small companies and those in the developed and emerging international markets.
Figure 2: Sector Weights Across Size and Regions
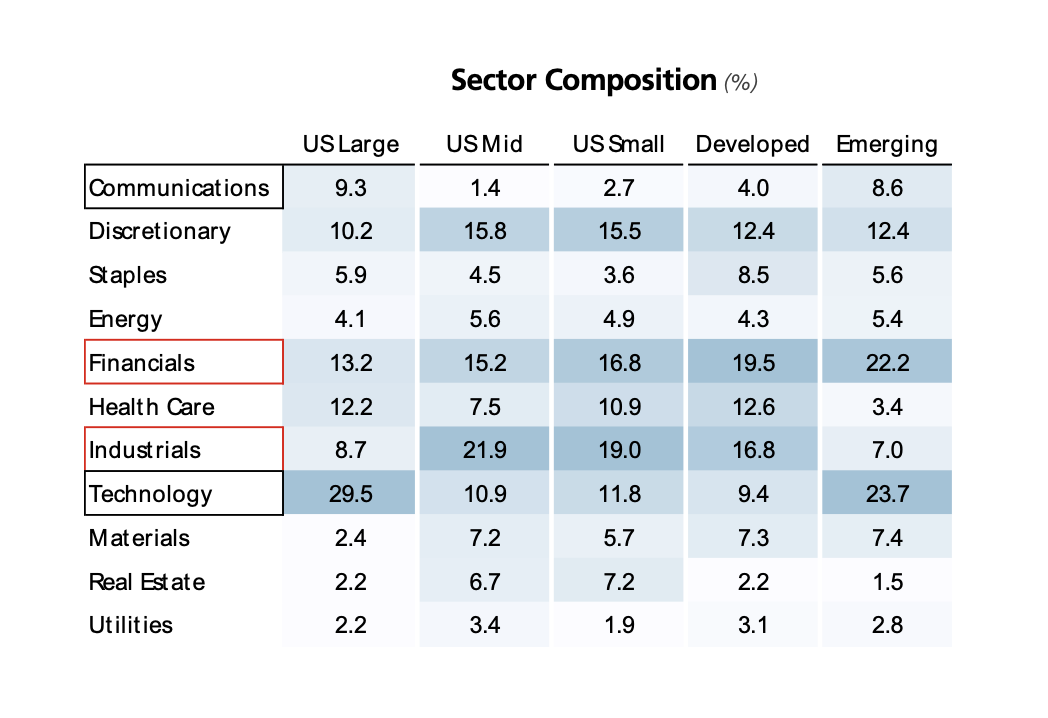
Source: FactSet, US Large: IVV ETF, US Mid: IJH ETF, US Small: IJR ETF, Developed: EFA ETF, Emerging: EEM ETF
Figure 2 shows larger sector weights within each of the five equity indexes in deeper shades of blue. Two key observations jump out from the heat map of sector weights.
i. The Technology and Communications sectors make up almost 40% of LRG, but are less than 15% of MID, SML and DEV.
ii. Conversely, the Financials and Industrials sectors make up almost 40% of MID, SML and DEV, but are just around 20% of LRG.
At its core, the higher weight in the higher P/E Technology and Communications sectors and the lower weight in the lower P/E Financials and Industrials sectors make LRG more expensive than MID, SML, DEV and EM.
We can adjust for sector weight differentials by equalizing all sector weights to a common level e.g. those seen in LRG. We can then compute sector-adjusted P/E ratios for each of the five equity sub-indexes.
Figure 3 shows sector-adjusted P/E ratios for a more apples-to-apples comparison with equal sector weights.
Figure 3: Sector-Adjusted P/E Ratios across Size and Regions
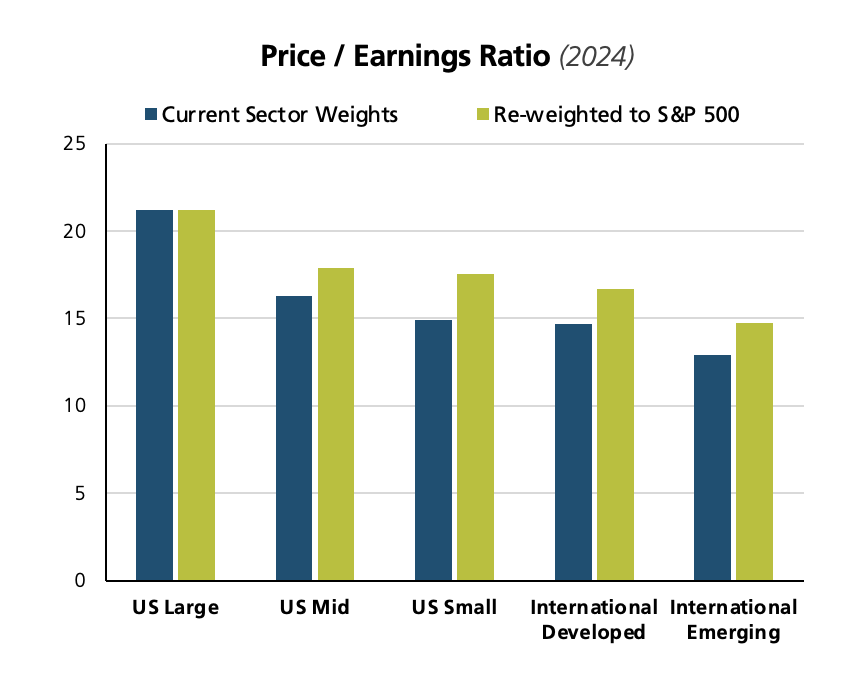
Source: Same as Figure 1
We can see that the green sector-adjusted P/E ratios show less dispersion than the original blue P/E ratios. The higher valuation of the U.S. large cap index is attributable to the presence of several leading companies whose superior fundamentals command a premium valuation. We believe sector composition is one reason why U.S. large cap stocks are justifiably more expensive.
Growth Prospects
The most general framework for stock valuations is based on discounted cash flow analysis. The price of a stock today is the present value of all future cash flows. In a simplified model with constant parameters, the P/E multiple can be estimated from the dividend payout ratio, the growth rate of cash flows and the required rate of return.
It is both well-documented and intuitive that the higher the growth rate, the higher the P/E multiple. The required rate of return incorporates a “risk premium” which compensates investors for bearing greater risk. The more risky the stock, the higher the required rate of return and the lower the P/E multiple.
We first look at the growth rate of earnings and then the riskiness of companies to understand variations in P/E ratios.
Even though stock valuations are a function of both growth rates and riskiness, a useful heuristic has evolved over the years for those investors who wish to focus primarily on a company’s growth prospects. The P/E to Growth (PEG) ratio divides the stock’s P/E ratio by its growth rate. Although blunt and narrow in scope, this simple adjustment neutralizes the effect of growth rates on P/E ratios. The higher the growth rate, the lower the PEG ratio and the cheaper the stock valuation.
While intuitive, the actual calculation of the PEG ratio is a bit complicated by the difficulty in estimating growth rates. Although historical earnings growth rates can be easily calculated, they may not be a reliable indicator of future growth rates. Analyst earnings estimates are generally available for the next two fiscal years; longer-term future growth rate estimates are either unreliable or simply not available.
Since the PEG ratio is a simplified valuation metric, estimation errors in growth rates become less meaningful. In any case, growth rates tend to be fairly correlated over time and, therefore, do not change abruptly.
We compare the three U.S. equity indexes on PEG ratios in Figure 4. We use available analyst earnings estimates to calculate future intermediate term growth rates. The P/E ratio is still based on 2024 earnings estimates.
Figure 4: PEG Ratios across U.S. Size Indexes
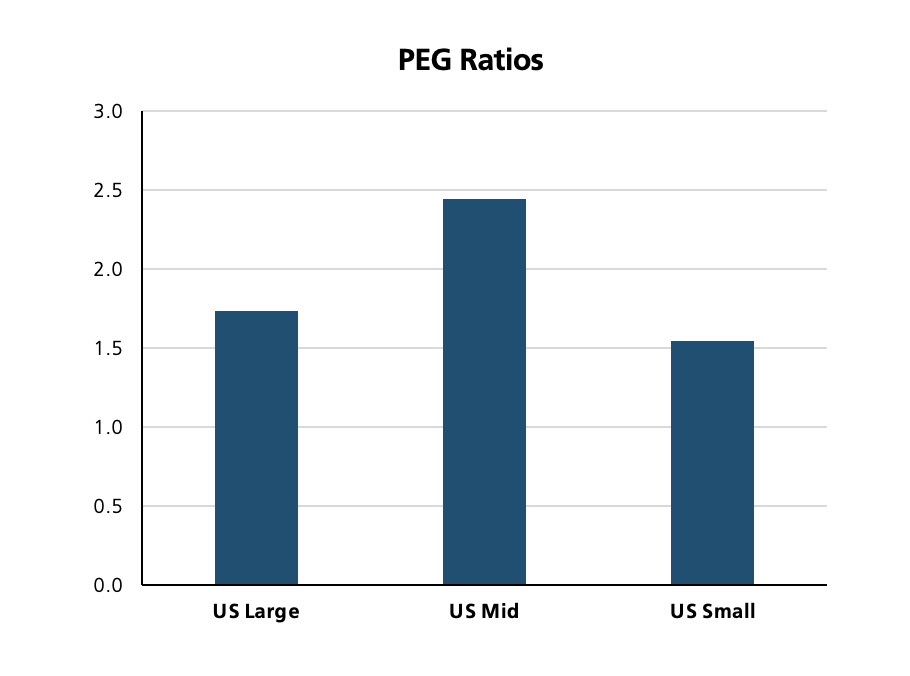
Source: Same as Figure 1
We saw earlier that, based on just P/E ratios, LRG is more expensive than MID, which in turn is more expensive than SML.
Figure 4, however, depicts a different picture after adjusting for growth. The PEG ratios for the three equity size indexes look more uniform; MID actually looks the most expensive based on this measure. This shift in relative value comes from differences in earnings growth rates. LRG has a stellar double-digit earnings growth rate while MID has a growth rate which is only half as high.
The high growth projections for the Magnificent 6 (Nvidia, Microsoft, Apple, Alphabet, Meta and Amazon) highlight the importance of this factor. The Magnificent 6 are expected to grow sales by 13%, earnings by 17% and free cash flow by 22% annualized over the next five years; it makes perfectly good sense for this impressive growth trajectory to drive elevated P/E multiples.
We conclude this section with a simple observation. The higher valuations of U.S. large cap stocks may be more attributable to higher growth rates than to mere speculation.
Finally, we take a look at the diffuse and amorphous concept of fundamental quality to further understand differences in P/E ratios.
Fundamental Quality
We have so far discussed size, value and growth; they are all fundamental drivers of stock valuations and returns. The common theme across these three factors is that they can be defined easily and measured fairly precisely. Size is simply market capitalization, value is the ratio of price to earnings, sales, free cash flow or book value and growth measures the annualized change in earnings, sales or free cash flow.
Unlike these clear and homogenous factors, the concept of quality tends to be more nebulous and heterogeneous. Some investors may associate high quality with high profitability; they would focus on return on assets, return on equity and return on invested capital. Others may look for more efficient capital allocation in the form of reduced debt, higher dividends and more share buybacks.
Yet others would approach quality from the perspective of how risky a company is. In this instance, higher quality would imply better balance sheets and stronger income statements derived from superior business models. Attributes that capture high quality in this vein may include low earnings variability, low volatility of operating margins, low financial or operating leverage and low accounting accruals.
The heterogeneity of high-quality companies and their myriad risk exposures make it difficult to quantify the impact of the quality factor on valuations. Nonetheless, it is reasonable to infer that high quality embodies stability, durability and resilience and should lead to higher valuations.
For the scope of this article, we stick with a qualitative discussion of the quality theme. We look at return on invested capital (ROIC) as a broad measure of profitability. Companies invest capital in people and assets to earn a rate of return. In order to be accretive to economic value, this return must exceed the firm’s weighted average cost of debt and equity capital.
The return on invested capital is a powerful profitability metric that affects both current valuation and future earnings and returns. Large increases in ROIC will enhance firm value and generate higher returns. A high level of current ROIC captures past value creation and is reflected in higher valuations.
We examine ROIC and other measures of profitability for our five equity indexes. We also look at the relative volatility of earnings and margins. Here are some generalized observations.
a. The return on invested capital for U.S. large companies is higher than it is for any of the other size or regional indexes. In fact, the ROIC for LRG is almost double the ROIC for SML. The same is true for return on equity.
b. Return on invested capital for LRG now exceeds 10% and its return on equity is greater than 20%. These are unprecedented levels of profitability for any stock market index. We believe these levels and trends are sustainable for U.S. large companies.
c. At the same time, the relative standard deviation for ROIC as a risk measure is almost twice as high for MID and SML as it is for LRG. The relative standard deviation for operating margins follows a similar pattern.
U.S. large cap stocks have higher financial and operational quality. They are fundamentally more profitable and less risky than their small cap and international counterparts. We believe a big portion of their premium valuation comes from the positive quality differential in their favor.
Summary
Investors are mindful of high stock valuations overall and the potential for a broadening of this stock market rally beyond mega-cap growth companies. Against this backdrop, they are focused intently on uncovering relative value within equity sub-asset classes such as small cap, value, international developed and emerging market stocks.
We assess whether the big valuation differential between U.S. large cap stocks and the other equity sub-indexes is justified fundamentally or simply a profitable mispricing opportunity. We look at sector composition, growth prospects and fundamental quality as potential drivers of valuation differentials.
U.S. large cap stocks have a greater representation of highly profitable, faster growing and higher P/E Technology and Communications companies. They also encompass higher fundamental quality as defined by a myriad of factors.
In large part, small cap, value and foreign stocks are cheaper for a good reason. They are more heavily invested in less attractive companies and industries which exhibit lower profitability, slower growth, lower quality and greater fundamental risk in earnings and margins.
We believe that adjusting for sector composition, growth rates and fundamental quality eliminates most of the valuation differences across equity sub-indexes. It may yet make sense to look beyond U.S. large cap stocks. We believe the reason to do so would be for the macro considerations of a revival in growth and risk appetite; it is less likely because of fundamental mispricing at a micro level.
We are more comfortable that the coast is becoming clearer for risk assets. Since economic growth is stronger than expected, we do not expect a higher-for-longer interest rate backdrop to derail stocks. At the same time, we remain vigilant for unforeseen and unexpected risks to our outlook.
To learn more about our views on the market or to speak with an advisor about our services, visit our Contact Page.
Sector composition is one key reason why U.S. large cap stocks are justifiably more expensive.
The higher valuations of U.S. large cap stocks may be more attributable to higher growth rates than to mere speculation.
U.S. large cap companies also have higher financial and operational quality — they are more profitable and less risky.
From Investments to Family Office to Trustee Services and more, we are your single-source solution.

 Source: FactSet
 Source: Factset
 Source: Factset
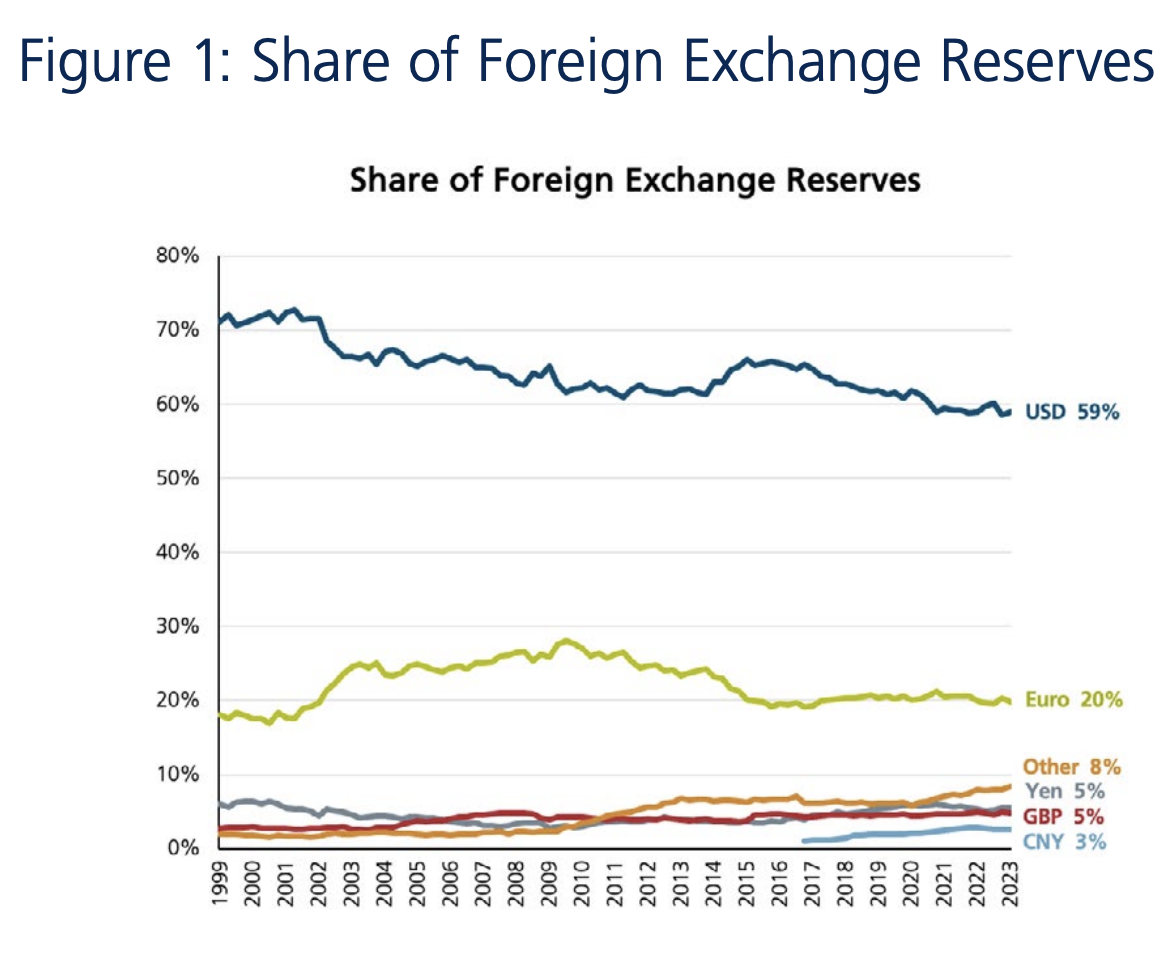
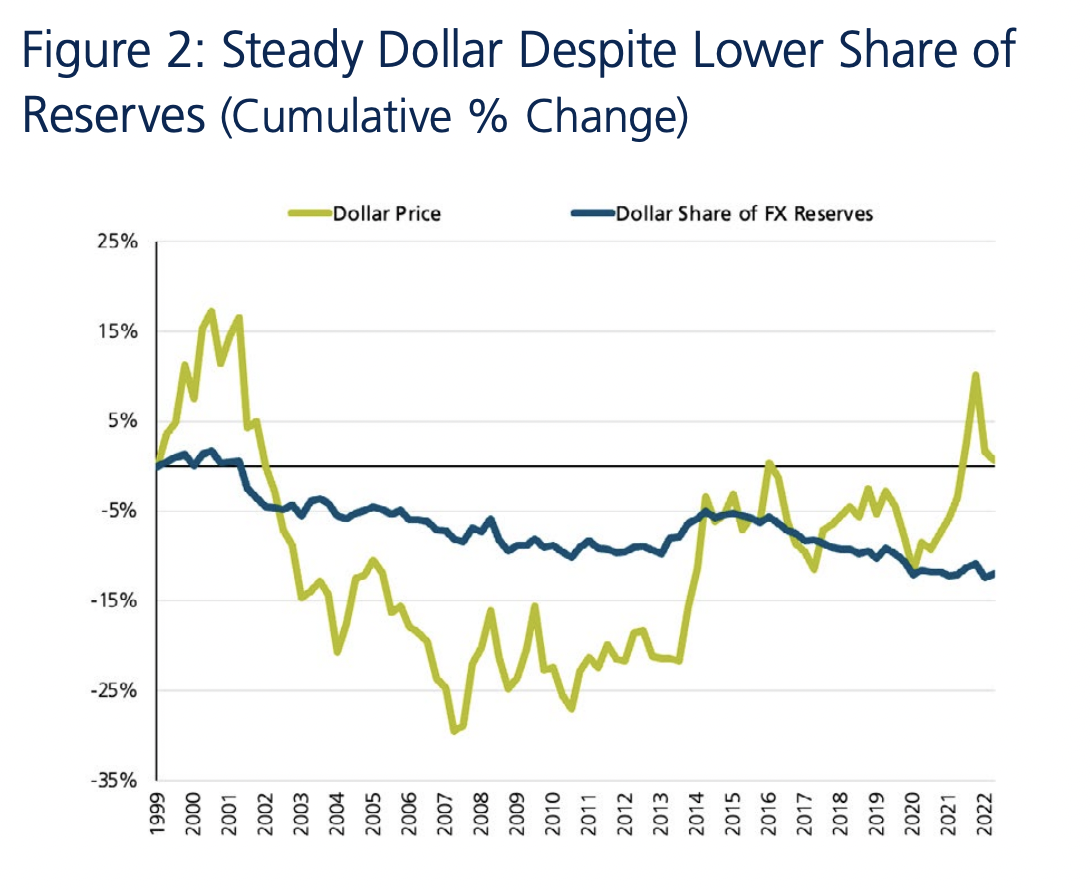 Source: IMF COFER. As of Q1 2023, share is % of allocated reserves, dollar price is for DXY trade-weighted dollar

")