Whittier Trust Grows San Diego Team and Fortifies Its Commitment to the Entrepreneurial Spirit with the Addition of Ted Fogliani.
Whittier Trust is pleased to announce the addition of Ted Fogliani as Vice President of Business Development in the firm’s San Diego office. A veteran entrepreneur and former CEO with over 25 years of experience building successful companies in eCommerce, SaaS, manufacturing, and logistics, Ted brings a dynamic mix of strategic vision, operational leadership, and a deep-rooted commitment to client service.
Ted joins Whittier Trust after serving as Founder and CEO of ShipCalm, a tech-enabled logistics company supporting eCommerce brands. There, he played a critical role in shaping the company’s growth strategy, culture, and customer-centric approach to supply chain management. Prior to ShipCalm, Ted spent two decades as Founder and CEO of a leading electronics manufacturing company, overseeing the production of medical devices, consumer electronics, and critical national defense systems.
“Ted’s background as a founder and operator gives him a unique lens into the needs, concerns, and aspirations of the entrepreneurs and business owners we serve,” said Whit Batchelor, Executive Vice President, Client Advisor, and San Diego Regional Manager at Whittier Trust. “He’s walked in their shoes. That perspective, combined with his strategic acumen and leadership experience, makes him a powerful advocate for our clients and a natural fit for our team.”
Throughout his career, Ted has championed the idea that long-term value is built by hiring great people and rallying them behind a clear vision. At Whittier Trust, he’ll focus on fostering meaningful relationships with families and founders across Southern California, helping them navigate the complex intersection of personal wealth and business leadership.
A lifelong Californian and long-time resident of the San Diego area, Ted and his wife Monica have raised their four children in Carmel Valley and Del Mar. They remain active in the community and are passionate supporters of organizations such as the San Diego Police Foundation and Boys to Men Mentoring.
For more information about Whittier Trust, start a conversation with an advisor today by visiting ourcontact page.
From Investments to Family Office to Trustee Services and more, we are your single-source solution.
Celebrating its 25th anniversary in 2025, the Whittier Trust Seattle Office continues to grow and strengthen its family office services with experienced CPA, Philip Cook.
Whittier Trust is proud to welcome Philip Cook as Vice President and Client Advisor in the firm’s Seattle office. A seasoned advisor with more than 18 years of experience in tax, estate planning, trust administration, and family governance in both California and Washington State, Philip joins the Pacific Northwest team of The Whittier Trust Company of Nevada, where he will serve ultra-high-net-worth families in both Seattle and Portland.
Philip brings to Whittier Trust a distinctive blend of technical expertise and personal insight, shaped by 12 years in public accounting with time at Deloitte and Andersen Tax, followed by six years as Director and Senior Director at Pacific Trust Company. There, he led the firm’s consulting practice, guiding families through the most complex aspects of estate structures, fiduciary oversight, and multi-generational planning.
“Philip's background as a CPA, combined with his leadership in trust and estate advisory work, aligns perfectly with Whittier Trust’s integrated and personalized approach,” said Nick Momyer, Northwest Regional Manager, Senior Vice President, and Senior Portfolio Manager at Whittier Trust. “He has a great ability to balance analytical rigor with a deep understanding of family dynamics, qualities that are central to the work we do.”
As Whittier Trust celebrates 25 years of service in Seattle and 60 years of dedication to the Pacific Northwest in 2025, Philip's arrival underscores the firm’s continued investment in its Seattle office and long-standing commitment to delivering comprehensive family office solutions across the region.
Philip holds a Bachelor of Arts in Economics from the University of California, Santa Barbara, and a Master of Accountancy from California State University, Fullerton. He is a licensed Certified Public Accountant (CPA) in Washington State. Originally from Southern California, Philip has called Seattle home since 2014, though he continues to spend time in Southern California working with clients and visiting family.
For more information about Whittier Trust, start a conversation with an advisor today by visiting ourcontact page.
From Investments to Family Office to Trustee Services and more, we are your single-source solution.
JoshElcik’s appointment reflects continued growth and a firm-wide commitment to a secure and seamless digital experience for Whittier Trust clients.
Whittier Trust is pleased to announce the addition of Josh Elcik as Senior Vice President and Director of Information Technology. A seasoned technology executive with more than two decades of experience leading at the intersection of innovation and operational strategy, Josh brings a depth of expertise in designing and implementing enterprise technology systems. He will be based in the firm’s Pasadena office.
Josh’s appointment comes at a time of meaningful expansion for Whittier Trust. As the firm continues to grow, so too does the demand for technology that is not only secure and scalable but also intuitive and responsive to the evolving needs of clients and their advisors.
“Josh joins Whittier Trust with a mandate to further modernize and fortify the systems that underpin our business,” said Thomas J. Frank Jr., Whittier Trust Executive Vice President and Northern California Regional Manager. “His leadership will help ensure we continue delivering the high-touch service our clients expect, supported by the kind of thoughtful, future-ready infrastructure that quietly powers it all.”
Over the course of his career, Josh has led large-scale digital initiatives across diverse industries, including financial services, energy, and media, each with a focus on long-term efficiency and enterprise agility. He is known for building high-performing global teams, championing cross-functional collaboration, and architecting integrated platforms that elevate both performance and compliance.
“I’m drawn to Whittier Trust’s legacy of excellence and its culture of precision and care,” said Josh Elcik. “Technology is most effective when it disappears into the background, empowering people to do their best work, and enabling clients to experience a seamless, secure relationship with their advisors. That’s the standard, and that is what we’re always building toward.”
Josh earned his degree in Management Information Systems from Texas Tech University. He maintains a deep interest in emerging technologies, data governance, cybersecurity, and adaptive organizational strategy.
Josh’s appointment reflects Whittier Trust’s ongoing investment in people, systems, and strategies that sustain exceptional client service in a complex and fast-moving world.
For more information about Whittier Trust, start a conversation with an advisor today by visiting ourcontact page.
From Investments to Family Office to Trustee Services and more, we are your single-source solution.
Whit Batchelor, from Whittier Trust's Newport Beach Office, is set to lead the expansion, strengthening client and community bonds within the region.
Whittier Trust is excited to announce the opening of its newest office in San Diego, reinforcing its deep commitment to serving clients in the region with a local, personalized approach. With a legacy rooted in Southern California, Whittier Trust has long advised clients and worked closely with charitable organizations based in San Diego. This expansion is a direct result of the wealth management company's continued growth in the region.
"Our decision to establish a full-time presence in the San Diego area reflects both the incredible growth we've seen here and the deep trust San Diego's most successful families have placed in us for decades," said David Dahl, President and CEO of Whittier Trust. "Our expansion into San Diego is also a reflection of our long-standing ties to the community," said David Dahl. "The Whittier family has a deep history in the region, and we are proud to strengthen our presence here, not just to better serve our clients, but to be closer to the charitable organizations and causes we have supported for years."
Whittier Trust's commitment to San Diego extends beyond wealth management, as the firm actively supports a variety of local organizations integral to the community. This includes the Helen Woodward Animal Center, which promotes animal welfare and pet adoption services; Scripps' Mericos Eye Institute and Whittier Diabetes Institute, advancing medical research and patient care; the San Diego-Imperial Council of the Boy Scouts of America, fostering leadership and service among youth; and the University of San Diego, where Whittier Trust contributes to higher education and leadership development initiatives.
Leading the new San Diego office is Whit Batchelor, newly appointed Executive Vice President, Client Advisor and San Diego Regional Manager. A longtime leader in Whittier Trust's Newport Beach office known for his dedication and accessibility to clients, Batchelor has worked extensively with ultra-high-net-worth individuals and families in San Diego, crafting tailor-made, multi-generational wealth management strategies. His leadership ensures a seamless transition for existing clients while setting the stage for further growth in the region.
"With this new office in San Diego, I am eager to build upon the legacy of trust, integrity and boutique service that Whittier Trust has cultivated for generations," said Batchelor. "I look forward to expanding our connections within the community, enhancing our ability to serve clients locally with tailored financial strategies and contributing to the vibrant culture of San Diego."
Complimenting this milestone of growth, this year also marks the 25th anniversary of Whittier Trust's Seattle Office. The firm also recently opened offices in Menlo Park and West Los Angeles and relocated its headquarters to a larger space in Pasadena to accommodate an increasing number of experienced professionals dedicated to serving a growing client base. As Whittier Trust continues to grow, its focus remains on providing the highest level of personalized service through a relationship-driven, client-first approach.
The office will be located at: 12770 El Camino Real, Ste 120, San Diego, CA 92130, twenty miles north of Downtown San Diego in Del Mar.
For more information about Whittier Trust's wealth management, estate planning and family office services, start a conversation with a Whittier Trust advisor today by visiting our contact page.
From Investments to Family Office to Trustee Services and more, we are your single-source solution.
The momentum from two years of remarkable economic resilience and strong market returns came to an abrupt halt in April 2025. The catalyst for market turmoil this time around was an unexpected turn in the administration’s global trade policy.
April 2, 2025 was touted as Liberation Day in anticipation of the long-awaited details on President Trump’s reciprocal tariff policy. The President used his executive authority to address the lack of reciprocity in U.S. bilateral trade relationships and to “level the playing field for American workers and manufacturers, re-shore American jobs, expand our domestic manufacturing base, and ensure our defense-industrial base is not dependent on foreign adversaries—all leading to stronger economic and national security” (Office of the United States Trade Representative).
However, the scope and magnitude of the proposed tariffs exceeded all expectations. In the initial Liberation Day proposal, all countries were subject to a minimum tariff rate of 10%. Countries with whom the U.S. has a large trade deficit were subject to even higher reciprocal tariffs.
The immediate reaction to the announcement was an immense fear of a global recession and a spike in inflation. Consistent with these fears, stocks sold off dramatically after the initial announcement. A temporary pause in reciprocal tariffs for all countries except China then halted the stock market decline. However, the U.S. dollar and bond market both fell sharply and unexpectedly during the week of April 7, 2025 in contrast to their conventional safe haven status.
We address concerns about higher inflation, higher rates, a recession, a bear market, and a weaker U.S. dollar in this article.
We are aware that this is a highly charged and contentious topic. We will, therefore, refrain from any ideological, philosophical, political, or moral judgment on the subject. We also realize that public disclosures on the topic may lack full transparency for reasons of national security. In a rapidly changing world, our views here have been penned in mid-April 2025.
How Did We Get Here?
The original impetus for higher tariffs is likely rooted in the fact that almost all of our trading partners charge a higher tariff on our exports to them than we do on their exports to us. For example, 2023 World Trade Organization data estimates that China, India and the UK have tariff rates of around 17%, 12% and 5% respectively on U.S. exports to them. In contrast, our corresponding tariffs on their exports to us are around 10%, 2% and 2% respectively. This mismatch in tariffs is probably further exacerbated by other unfair trade practices such as non-tariff barriers and currency manipulation.
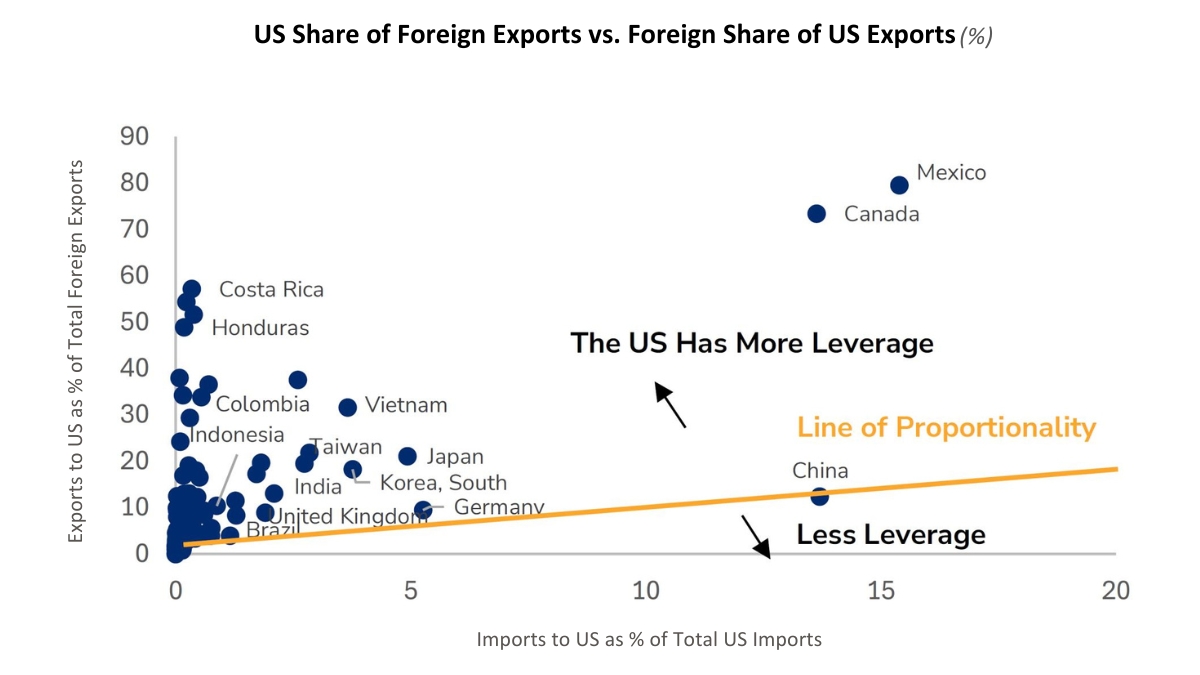
The administration’s policy on tariffs may have been further emboldened by the perceived leverage of the U.S. over many of its trading partners. Figure 1 shows how this leverage is achieved. It compares the importance of a country’s imports to us (x-axis) versus the importance of U.S. exports to its own global trade (y-axis).
Figure 1: Leverage in Trade Relationships
Source: Wolfe Research, World Integrated Trade Solution as of 2022
This chart helps us understand where the U.S. has more leverage with its trading partners. We explain Figure 1 with an example. Take Vietnam for instance. All imports to the U.S. from Vietnam account for only around 4% of total U.S. imports. However, those same Vietnam exports to the U.S. account for almost 32% of its total exports. In light of this imbalance, Vietnam is far more likely to negotiate than retaliate.
In Figure 1, it is clear that Mexico, Canada and several Emerging Markets countries in Asia and South America are most dependent on trade with the U.S., while countries in the EU have more equal trading relationships. China has the most trading leverage against the U.S.; its retaliation has, therefore, been fast and furious.
These salient data points had already been priced into expectations of a higher tariff rate of around 8% prior to Liberation Day. Nonetheless, markets were caught off guard on April 2nd at two levels—by the methodology of tariff calculations and the resulting magnitude of reciprocal tariffs.
Contrary to expectations of a more targeted approach, the reciprocal tariffs were derived from a rudimentary framework that aimed to reduce bilateral trade deficits. Each country’s tariff rate was determined by dividing the U.S. trade deficit with that country by total imports from that country. This number was then cut in half to create the new U.S. “discounted” reciprocal tariff. Here are some of the initial proposed reciprocal tariffs from Liberation Day: China 34%, EU 20%, Japan 24%, India 26%, Vietnam 46%, Switzerland 31% and UK 10%.
These initial reciprocal tariffs have since been suspended for 90 days for all countries except China from April 10th. In sharp contrast, tariffs with China have escalated exponentially through a sequence of retaliations; they now stand at 145% on Chinese exports to the U.S. and 125% on U.S. exports to China. U.S. tariffs on all other countries temporarily stand at the minimum baseline of 10%.
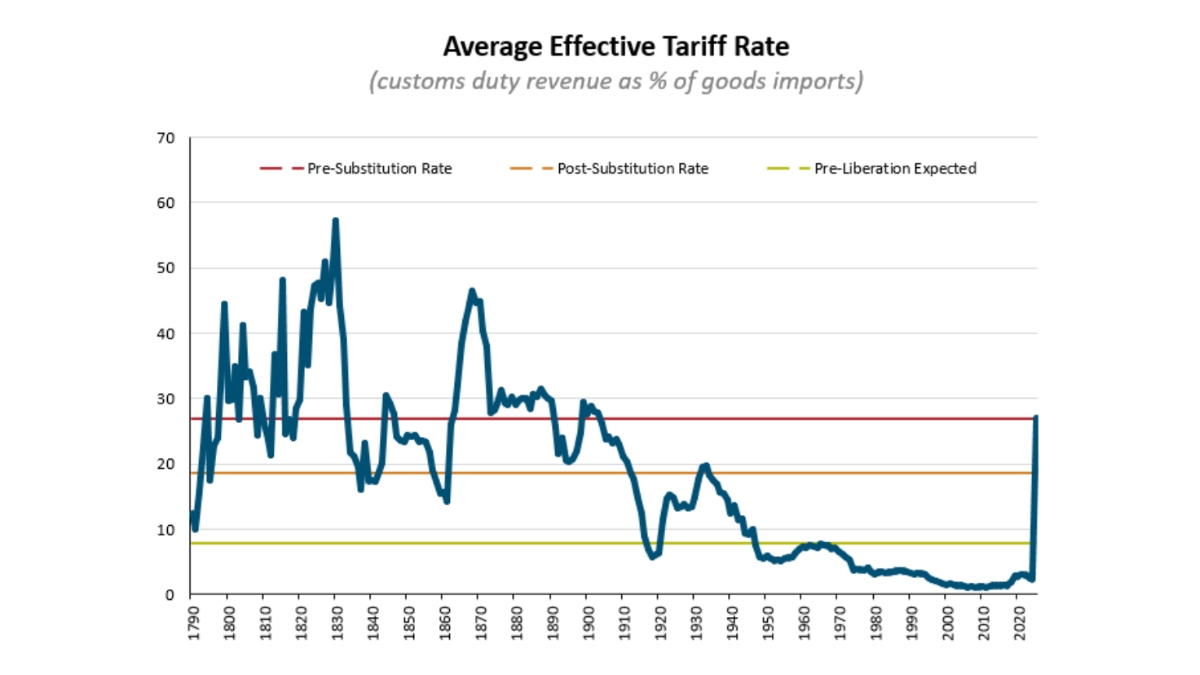
We summarize the revised April 10th levels of tariffs in Figure 2 before turning to our inferences and forecasts.
Figure 2: Average Effective Tariff Rate as of April 10, 2025
Source: The Budget Lab, Yale University
The average global tariff rate for the U.S. is now projected to go up more than 10-fold from 2.4% to approximately 27%. We label this average tariff rate as a “pre substitution” rate since it assumes that all flows of global trade remain constant and intact at 2024 levels. However, higher tariffs on Chinese goods may well trigger substitution to other cheaper imports. The resulting “post substitution” average tariff rate is lower and estimated to be 19%.
Thoughts on Current Trade Policy
We appreciate the desire to increase the U.S. manufacturing base and reduce foreign dependencies in industries critical to national security. We also applaud the pursuit of fairer terms for global trade.
Nonetheless, we initially believed that it was sub-optimal to achieve these goals with an aggressive trade policy alone. A number of tenets in the opening approach seemed misaligned with our global leadership role, created by our own dominant economy and strong alliances with others.
The costs of high fixed trade barriers are well-known, e.g. higher prices, slower growth, less competition, less innovation, and lower standard of living. The expansive and punitive trade war in its initial formulation on April 2nd risked a U.S. recession and an alienation of our allies.
The singular focus on reducing bilateral trade deficits through high imputed tariffs also felt misguided. A large portion of the U.S. trade deficit is driven by principles of comparative advantage where cost of production is often lower overseas and by cultural differences in our lower propensity to save and greater desire to consume. Besides, the large foreign trade surpluses eventually make their way back into U.S. dollar-denominated assets giving our stocks, bonds and currency hegemonic power.
These thoughts may also have preyed on investors’ minds as they indiscriminately sold risk assets. The S&P 500 suffered a 2-day decline of -10.5% on April 3rd and 4th. It was remarkably the first ever decline of such magnitude to be triggered by a policy initiative during benign times – as opposed to an existing endogenous fundamental crisis (e.g. Global Financial Crisis) or an unexpected exogenous shock (e.g. Covid).
Two recent developments have opened up a different possibility for the intent and scope of the current trade war: 1) The U.S. has rapidly escalated tariffs against China all the way up to 145% and 2) The U.S. has rapidly deescalated tariffs on all other countries down to 10% for 90 days. There may now be some credence to a scenario where the trade war is focused on curtailing China’s economic, manufacturing, scientific, technological, and military might while actually strengthening all other global alliances through reconciliation, collaboration and some coercion.
Future Evolution of Trade Policy
We have maintained since the elections that the bark of proposed tariffs will eventually be bigger than its final bite. We have been clearly surprised by the much louder bark and greater magnitude of the new reciprocal tariffs and the damage they have inflicted on the markets so far. Nonetheless, we still believe they will eventually be implemented at lower levels than the ones proposed on April 2nd.
Excluding China, we reckon that global tariffs will settle in at the 8-18% level. While an extensive and protracted global trade war remains a possibility, it is not our base case.
It would serve both the U.S. and China well to find an off ramp towards a more stable co-existence as the world’s two leading economies. If that doesn’t happen for any reason, it is conceivable that the U.S. may largely shift its trade dependence on China to other countries. As supply chains re-adjust, we expect the tariff shock to fade and be subsumed by the positive fundamentals of higher productivity growth, fiscal stimulus and deregulation.
Impact on the Economy
The direct impact of higher tariffs is clearly inflationary and recessionary. We also understand that high levels of policy uncertainty can take an indirect economic toll from reduced consumer spending, slower hiring and lower capital expenditures.
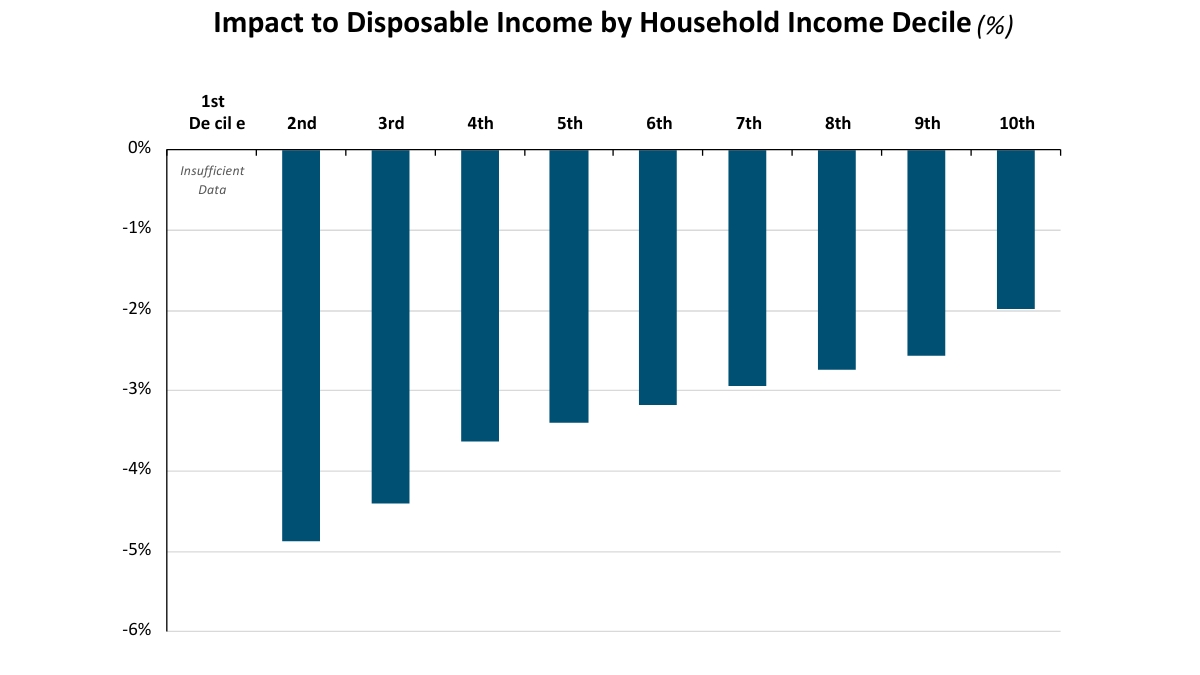
Since higher prices are tantamount to a tax on households, we begin by estimating the impact of tariffs on disposable incomes. Figure 3 shows the likely impact of the April 10 package of tariffs on disposable incomes across different deciles of household incomes.
Figure 3: Impact of Tariffs on Disposable Income
Source: The Budget Lab, Yale University
The top 10% of households by income (highest decile #10) in Figure 3 is expected to see the smallest disposable income decline of -2%. On the other hand, the lowest decile of household income may see disposable income fall by almost -5%.
Any reduction in consumer spending from a decline in disposable income will likely be uneven and disproportionate across income categories. A -2% decline in disposable income for the highest income households may have virtually no effect on their spending. Since most of the aggregate consumer spending takes place in high income households, we are optimistic about a relatively muted impact of tariffs on growth.
We expect up to a -1% direct impact of tariffs on GDP growth and up to a -0.5% indirect impact. Therefore, we expect GDP growth to be reduced by -1% to -1.5% in 2025. From a strong starting point of 2.5% real GDP growth, we expect 2025 growth will still be above zero even after our anticipated reduction.
While the odds of a recession or “stagflation” have gone up, neither scenario is our base case. We estimate the odds of a recession to be 30%, which is well below the consensus expectation of 60-70%.
It is evident that inflation will likely be higher in 2025, but we expect it to subside in 2026 as the world adjusts to a new global trade order. On a positive note, we observe that inflation expectations for a 5-year period starting in 2030 have actually declined from 2.3% to 2.1% as of April 11, 2025. We believe current Treasury bond prices are overestimating long-term inflation risks.
Impact on the Markets
U.S. Stocks
The U.S. stock market has seen some wild swings in 2025. Here is the most striking statistic we have found on recent stock market volatility: If you add up all the absolute intra day moves of 3% or more in the 3 trading days between April 7th and April 9th, the S&P moved a monumental 52%!
In the midst of such high volatility and uncertainty, it is difficult to form an outlook for U.S. stocks. We give the task at hand our best analytical effort and intuitive judgment by forecasting both expected S&P 500 earnings and P/E multiples.
We have observed over the years that earnings growth for the S&P 500 tends to be 3-4 times U.S. GDP growth. Based on our view above that GDP growth may be lower by -1% to -1.5%, we expect S&P 500 earnings growth may also be lower by around -4% to -5%. Despite a reduction in the earnings growth rate because of tariffs, earnings will still rise in the next 12 months.
We have a more differentiated view on where trough multiples will likely end up. In prior recessions, they have fallen to as low as 10-13x. In non-recessionary growth scares, they have fallen to 15-16x.
We believe trough multiples will be higher during this growth scare. The current economic and market crisis is policy-induced; up to a certain point, the antidote for the crisis also remains in the hands of policymakers. And as a beacon of hope and optimism, we already have light at the end of the tariff tunnel in the form of fiscal stimulus and deregulation. Therefore, we strongly believe the trough P/E multiple will be higher this time at about 18x.
We also know that trough earnings and trough P/E multiples are never coincident; you cannot see them simultaneously. You typically see trough prices first, then trough multiples and finally trough earnings.
With these building blocks in hand, we estimate that a viable floor for the S&P 500 may exist at the 4,900-5,000 level. While we obviously cannot rule out lower prices, we may just about avoid a bear market by remaining above its closing price threshold of 4,915.
Our base case rules out a bear market, expects the current correction will not be protracted and predicts the S&P 500 will deliver a positive return in 2025.
U.S. Bonds and Dollar
The manic turmoil in the U.S. bond and currency markets during the week of April 7th could well be the topic of an entire article. We confine ourselves to a few key observations here.
Treasury bond prices and the U.S. dollar both fell significantly in the second week of April. This is an extremely rare occurrence, and it triggered profound fears that we were at the beginning of the end of U.S dominance in global bond and currency markets. Critics attributed the selloff to fundamental factors ranging from heightened U.S. fiscal risks caused by an imminent recession to a devastating loss of confidence in U.S. institutions and leadership.
We do not believe those factors were central to the meltdown in U.S. bonds and the dollar. Instead, we believe it originated from a more nuanced and niche event in the bond market. It is widely understood that hedge funds were unwinding a very large and highly leveraged “bond basis” trade in the face of low liquidity and high volatility. This forced and rapid liquidation created significant price dislocations in both Treasury bonds and the U.S. dollar.
We expect U.S. Treasury bonds and the dollar to stabilize in the coming weeks. We believe the 10-year Treasury yield should be closer to 4.1-4.2% in the near term and around 4.5-4.6% in the long run.
Summary
We close out our discussion on a positive and optimistic note.
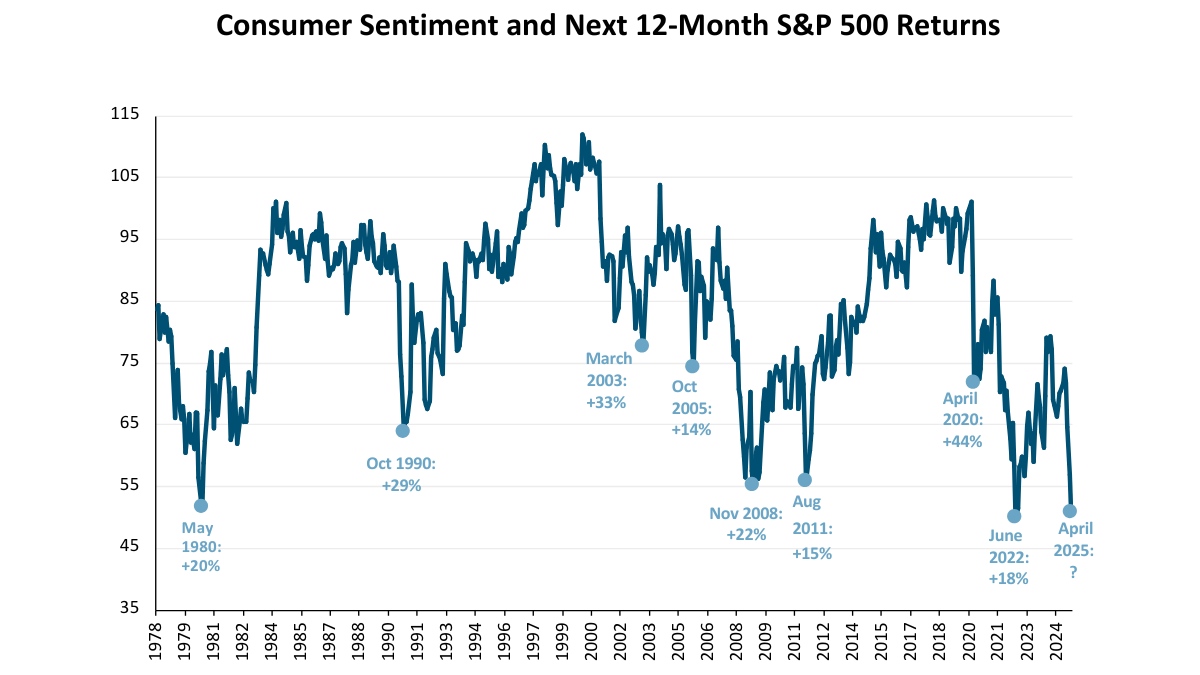
We know from prior experience that high levels of consumer pessimism, policy uncertainty and fear gauges tend to be contrarian in nature. In other words, stock market returns in the aftermath of high pessimism or fear have historically been high. Figure 4 shows the contrarian nature of consumer sentiment.
Figure 4: Consumer Sentiment is Contrarian
Source: University of Michigan, JPMAM, as of April 2025
The latest reading of consumer sentiment nearly reached its all-time low mark of 50.0 on April 11, 2025. While it accurately reflects coincident pain in the economy, it sadly lags the direction of future stock prices.
The stock market tends to look 9-12 months ahead and generally bottoms out when things are at their worst and about to get better. If history is any indication, stock returns over the next 12 months may be handily positive.
We summarize our key takeaways below.
We believe final tariffs will be lower than those proposed currently; their impact on inflation, GDP growth and corporate profits will also be lower than currently feared.
We assign a low probability to a recession, “stagflation” or a bear market.
We do not anticipate a protracted correction in stock prices; we expect the S&P 500 to deliver a positive return in 2025.
We believe fears of “de-dollarization” and significantly higher Treasury yields are overblown; we expect the bond market and the U.S. dollar to halt their declines in the coming weeks.
Within client portfolios, we are focused on adding to or buying new high quality securities that have sold off disproportionately in this “tariff turmoil”. In these uncertain times, we remain careful, prudent, disciplined, and prepared to act on emerging opportunities.
To learn more about our views on the market or to speak with an advisor about our services, visit our Contact Page.
Bringing Decades of Wealth Management Expertise to San Diego’s Ultra-High-Net-Worth Families
Whittier Trust is pleased to announce that Whit Batchelor has been appointed as Executive Vice President, Client Advisor and San Diego Regional Manager, where he will lead the firm’s newest office in San Diego. This appointment underscores Whittier Trust’s dedication to internal leadership development and its commitment to maintaining a client-first culture and relationships spanning generations through experienced, long-tenured professionals.
“Whit’s deep expertise, strong relationships and dedication to client service make him the ideal leader for our official expansion into San Diego,” said David Dahl, President and CEO of Whittier Trust. “Having been with Whittier Trust since 2011, Whit has played a pivotal role in guiding our clients in Southern California. His time as part of the leadership in Newport Beach, coupled with his strong community involvement and extensive work already with clients in San Diego, ensures a seamless transition as we further grow our presence in the region to continue serving our clients locally.”
During his tenure at Whittier Trust’s Newport Beach office, Batchelor spent more than a decade expertly navigating the complex financial landscapes of high-net-worth individuals and families, crafting personalized, multi-generational strategies that align with each family's distinct goals and values. His expertise spans wealth and investment management, estate planning, tax optimization, balance sheet management and comprehensive financial advisory services, essential for a premier multi-family office. Known for his dedication and accessibility, Batchelor cultivated lasting relationships with clients and their families, ensuring continuity and a bespoke approach to financial services. His deep familiarity with the San Diego market, forged through years of building relationships and advising families in the area, further positions him uniquely for this role.
In addition to his expertise in wealth and investment management, estate planning and tax optimization, Batchelor has been an active participant in community initiatives throughout Southern California. While in Newport Beach, he was deeply engaged in service projects and philanthropic efforts, including his tenure on the board of Make-A-Wish Orange County & the Inland Empire, where he served as board chair. He brings this same spirit of community involvement and service to San Diego, where he envisions the office playing an integral role in both client service and regional philanthropy.
Whit Batchelor holds an undergraduate degree from the University of Vermont and an MBA with a finance concentration from California Lutheran University. He is a Certified Trust and Financial Advisor (CTFA) and a Certified Financial Planner (CFP). Outside of work, he enjoys spending time with his wife and three children, pursuing outdoor activities such as sailing, skiing and mountain biking.
As Whittier Trust officially opens this new office in San Diego, the wealth management firm remains committed to its tradition of thoughtful leadership selection, ensuring that every client continues to receive the personalized and sophisticated wealth management services that define the Whittier Trust experience.
For more information about Whittier Trust, start a conversation with an advisor today by visiting ourcontact page.
From Investments to Family Office to Trustee Services and more, we are your single-source solution.
Whittier Trust Strengthens Client Service Excellence Within Reno and San Francisco Offices Through Advancement of Distinguished Internal Talent.
Whittier Trust is pleased to announce the promotions of Mathew N.S. Neben to Senior Vice President, Portfolio Manager, and Charlie R. Normandin to Vice President, Client Advisor. These advancements reflect Whittier Trust’s continued commitment to finding and developing top-tier talent and its dedication to providing personalized, relationship-driven wealth management services.
“Charlie and Mat exemplify Whittier Trust’s core values—deep expertise, a client-first mindset, and an unwavering commitment to excellence,” said David Dahl, President and CEO of Whittier Trust. “Charlie’s meticulous approach to fiduciary and financial planning and Mat’s leadership in investment strategy reinforce our mission to deliver highly personalized, long-term wealth solutions.”
Mathew Neben has been elevated to Senior Vice President, Portfolio Manager in Whittier Trust’s Reno office. With over a decade at the firm, Mat manages equity, fixed income, and alternative assets for high-net-worth individuals and foundations. As a member of Whittier Trust’s Investment Committee, he helps shape the firm’s overall investment strategy and conducts in-depth analysis of companies in the Communication Services sector. In his new role, he will continue to refine Whittier Trust’s investment approach while deepening client relationships through customized portfolio management.
Charlie Normandin steps into the position of Vice President, Client Advisor in Whittier Trust’s San Francisco office. Since joining the firm in 2020, Charlie has been instrumental in providing tailored family office services, fiduciary guidance, and financial planning for high-net-worth clients. His keen attention to detail allows him to craft optimal solutions to complex wealth management challenges. In his expanded role, Charlie will continue to deliver strategic financial advice while strengthening Whittier Trust’s client service capabilities in the San Francisco Bay Area.
Beyond their professional achievements, both Mat and Charlie are dedicated to their local communities. Mat serves on the Board of Directors of the Boys & Girls Club of Truckee Meadows, supporting youth development initiatives in Northern Nevada. Charlie is an active member of the San Francisco Estate Planning Council and a passionate advocate for youth organizations, including the Boys & Girls Club.
Whittier Trust views its employees as the foundation of the firm’s success. By fostering a culture of leadership, collaboration, and mentorship, the wealth management company enables team members to grow both personally and professionally. With diverse experiences and expertise, each team member brings fresh insights and innovative solutions that enhance the client experience. Through ongoing knowledge sharing and professional development, Whittier Trust empowers its advisors and portfolio managers in each office to deliver exceptional service, providing clients with local strategic guidance and personalized wealth solutions to preserve and grow their assets for generations.
For more information about Whittier Trust, start a conversation with an advisor today by visiting ourcontact page.
From Investments to Family Office to Trustee Services and more, we are your single-source solution.
Bringing 13 Years of Wealth Management Expertise, Edward Troy Will Continue to Enhance the Firm’s Legacy of Personalized Wealth Management.
Whittier Trust is pleased to announce the appointment of Edward Troy, CFA, as Senior Vice President and Client Advisor in the firm's Pasadena office. With over 13 years of experience guiding high-net-worth families and institutional investors, Edward Troy brings a wealth of expertise in investment management, tax strategy, and wealth planning.
As the oldest multi-family office headquartered on the West Coast, Whittier Trust has built a legacy of excellence in wealth management, providing personalized investment and advisory services to generations of clients. A hallmark of the firm’s success is its deep bench of expert Client Advisors, who serve as trusted partners in developing tailored solutions that preserve and grow wealth over time. Edward’s addition to the team reinforces Whittier Trust’s commitment to top-tier talent and its dedication to delivering exceptional, relationship-driven service.
“We’re excited to welcome Edward to Whittier Trust,” said Peter Zarifes, Managing Director–-Head of Wealth Management at Whittier Trust. “His ability to blend technical expertise with a personal, relationship-driven approach is exactly what sets us apart. Edward doesn’t just manage wealth—he helps clients build meaningful legacies that last for generations.”
Prior to joining Whittier Trust, Edward served as Vice President at Offit Capital Advisors, where he managed portfolios for multi-generational families, endowments, and foundations. His strategic approach and deep understanding of complex financial landscapes have earned him a reputation as a trusted advisor in the industry.
Edward holds a Bachelor of Science in Economics from the University of California, San Diego and is a Chartered Financial Analyst (CFA). He is an active member of the CFA Institute and the CFA Society of Los Angeles.
Outside of work, Edward enjoys traveling with his wife and children and spending time outdoors with close friends.
For more information about Whittier Trust, start a conversation with an advisor today by visiting ourcontact page.
From Investments to Family Office to Trustee Services and more, we are your single-source solution.
The U.S. economy has now remained resilient to the massive post-pandemic inflation shock for well over two years. As a result, the economic outlook has changed dramatically from the inflation peak in June 2022. We trace this progression to assess where we stand now and what lies ahead.
The longest economic expansion on record from 2009 to 2020 established a new, lower trend-line real GDP growth rate of just below 2% for the U.S. economy. Against this benchmark, investor expectations have shifted sequentially through the following four phases of real GDP growth from 2022 onwards.
Inevitable recession - Negative growth, well below 0%
Soft landing - Below-trend growth, above 0% but below 2%
No landing - Trend growth, around 2%
“Launch” landing - Above-trend growth, above 2%
We describe the last scenario as a “launch” landing in our lexicon and believe the new post-pandemic economic cycle will normalize at real GDP growth above 2% in 2025 and beyond.
While this evolution of the economic outlook may have surprised many investors, it almost played out as we expected three years ago. We were firmly of the opinion that inflation would subside rapidly as pandemic-induced supply shortages resolved on their own. We believed the U.S. economy had become more insulated from interest rate increases as consumers and corporations locked in low, long-term, fixed rates for their loan obligations. We had all but ruled out a recession and believed that growth was likely to surprise to the upside.
The momentum of the economy in 2024 was strong enough to overcome the uncertainty of the U.S. elections. If anything, the unexpected GOP sweep in November raised hopes of an even stronger economy on the heels of continued fiscal stimulus and deregulation. Company profits in 2024 were almost in line with lofty forecasts and earnings growth expectations for both 2025 and 2026 are still high at 13-15%.
It is no surprise then that the U.S. stock market delivered strong performance yet again in 2024. The S&P 500 index rose by 25.0%; the Nasdaq index, which includes the Magnificent 7 group of technology leaders, gained 29.6%; and the Russell 2000 index of small companies was up 11.5%. In fact, the S&P 500 index has now delivered the rare outcome of back-to-back total returns of at least 25% in two consecutive years.
The continued strength in the U.S. economy and stock market brought a lot of cheer to investors in 2024. However, it has now led to two major concerns in 2025.
Investors got clear evidence in July 2024 that the Fed could soon start cutting interest rates when headline CPI inflation registered its first post-pandemic monthly decline. From that point on, investors aggressively priced in multiple rate cuts under the benign scenario of continued disinflation and solid Goldilocks growth which was neither too hot nor too cold.
These expectations began to unravel towards the end of 2024. As investors began to price in a Trump win and then eventually saw the GOP sweep, interest rates began to rise in anticipation of a number of knock-on effects related to the election outcome.
a. Higher economic growth from continued fiscal stimulus, a new regime of deregulation and technology-led growth in productivity
b. Higher fiscal risks from larger fiscal deficits
c. Higher inflationary pressures from both higher growth and new policies on tariffs and immigration
At the same time, prospects of higher economic growth and higher corporate profits pushed stock prices and valuations higher.
In the last four months (from mid-September to the time of writing), interest rates have risen by more than 1%. Market expectations of Fed rate cuts have now declined to less than two; in fact, many are now assigning a non-zero probability to rate hikes in 2025. And in the stock market, strong returns have pushed valuations higher; the forward P/E for the S&P 500 stood at 21.5 at the end of December 2024.
These data points now pose the following risks to investors.
Will interest rates stay high or go even higher? Will high(er) interest rates bring down the stock market and eventually stall the economy?
Even if the stock market survives the burden of high interest rates, will it buckle under the weight of its own (high) valuations?
We address these two key questions on the way to developing our 2025 economic and market outlook.
Interest Rates
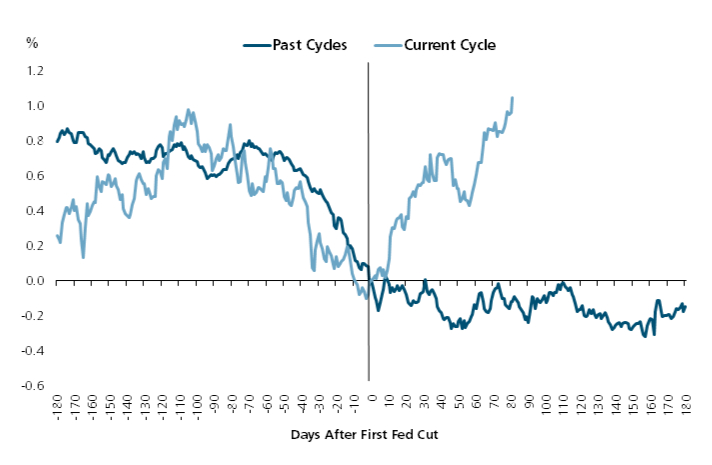
The recent low in the 10-year Treasury bond yield was 3.6% on September 16, 2024. After a strong jobs report on January 10, 2025, the 10-year Treasury yield almost reached 4.8%. This 1.2% increase is significant because it is unusual for long-term rates to move higher after the onset of a Fed easing cycle.
We see this historical anomaly more clearly in Figure 1.
Figure 1: 10-Year Treasury Yield Before and After First Fed Cut
Source: FactSet; Average includes rate cuts from June 1989, September 1998, January 2001, September 2007 and July 2019; as of January 10, 2025
Long-term interest rates normally decline when the Fed starts cutting rates. The simultaneous decline in both short-term and long-term interest rates is intuitive. Fed rate hikes usually slow the economy down to the point where rate cuts become necessary to prop it up. Fed rate cuts normally coincide with economic weakness and, therefore, a decline in long-term rates.
The divergent trend in Figure 1 is another reminder about the inefficacy of monetary policy in this economic cycle. At the outset, post-pandemic inflation was more attributable to supply side disruptions and fiscal stimulus than it was to monetary stimulus. Then, Fed rate hikes and higher interest rates didn’t cause the type of demand destruction that one would have normally expected. And now, expectations of higher growth are being driven by factors other than monetary policy.
We make an argument in the following sections that we are shifting to a higher gear of growth in this economic cycle. We observe in passing that the drivers of economic growth are also shifting. We believe the baton for higher future growth has now been handed off from monetary policy to higher productivity growth, deregulation and fiscal stimulus.
The first stage of our interest rates analysis is to understand why they are going up.
Nominal interest rates are comprised of two components: 1) inflation expectations and 2) real interest rates. We look at each of these factors separately.
Inflation Expectations
Under normal conditions, the 10-year Treasury yield will generally exceed inflation expectations for the next 10 years. Longer term policies drive these inflation expectations more than shorter term trends. In the current setting, inflation fears have been elevated by prospects of higher growth, immigration policies that may reduce the supply of workers and the implementation of proposed tariffs.
We do not believe that 10-year inflation expectations have changed materially in the last few months. For a while now, we have thought the Fed’s 2% inflation target was likely to be elusive. Our fair estimate of 10-year inflation expectations is slightly higher at around 2.25%.
We believe the market is mispricing a higher level of expected long-term inflation. We support our more benign view on inflation with the following observations.
i. We know high universal tariffs can be inflationary and harmful to domestic growth. We don’t believe they will be implemented as originally proposed; they will ultimately be selective, targeted and reciprocal. We believe the threat of tariffs is likely a negotiating tactic; it is aimed more at opening up foreign markets than at sourcing revenue. The bark of expected tariffs will probably end up being a lot worse than its actual bite.
We believe that the impact of immigration policy on the economy will also be less severe than anticipated.
ii. Inflation has been trending higher in recent months. We believe there may be some unusual base effects at play in these short-term trends. CPI prices fell in the fourth quarter of 2023, then rose sharply in the first quarter of 2024 and have been fairly steady thereafter. As a result, year-over-year changes in CPI inflation may come down in the coming months.
In any case, these recent trends are unlikely to materially affect inflation over the next 10 years. Counter to growing investor concerns, expectations for 5-year inflation, starting in 5 years from now, have remained well-anchored at about 2.3% even as long rates have gyrated violently.
iii. And finally, we maintain our high conviction that technology will continue to create secular disinflation in the coming years. We are hard pressed to think of enough inflationary tailwinds to overcome this one powerful disinflationary force.
We next look at the other potential drivers of the increase in long-term interest rates.
Real Interest Rates
Real interest rates are primarily influenced by long-term changes in the level of economic activity. Increases in economic growth rates cause the real interest rate (and, therefore, the nominal rate as well) to increase and vice versa. In fact, one of the more useful heuristics in the capital markets is that long-term nominal interest rates are typically bounded by the long-term nominal GDP growth rate expectations.
For the sake of completeness in our analysis, we make a small detour here to resolve one other nuanced driver of changes in real interest rates — changes in the risk premium. If investors perceive fiscal risks to be higher, they will in turn demand a greater compensation for bearing that risk through higher interest rates.
There is a great deal of angst that the incoming administration will continue to increase government spending and the fiscal deficit. We tackled this concern about greater fiscal risks comprehensively in our 2024 Fourth Quarter Market Insights publication.
For a myriad of reasons, we concluded that fiscal risks are not as elevated as feared and unlikely to trigger higher inflation or higher interest rates. We believe that any pricing of a higher risk premium into higher nominal yields today is unwarranted.
We resume our focus on the topic of economic growth.
In a material shift in our thinking, we now see the U.S. economy shifting to a higher growth gear in the next decade. In the pre-Covid economic cycle, real GDP growth in the U.S. averaged an anemic sub-2%. We expect real GDP growth will now exceed 2.5% over the next 2-3 years and conservatively average 2.25% over the next decade.
These forecasts imply an upward shift of at least 0.5% in real GDP growth from the prior cycle. At first glance, this may seem overly optimistic because of the obvious headwind of an ageing population.
We know the natural or potential growth rate of an economy has two basic components: 1) growth in the labor force and 2) productivity gains of existing workers. We concede that unfavorable demographics and potentially adverse immigration policies will likely reduce the size of the future labor force.
This places the onus for higher GDP growth squarely on the second factor of increased productivity. In fact, with flat to negative growth in the labor force, productivity will need to increase by 0.5-1.0% to boost GDP growth rates by 0.5% or more. How feasible is this outcome and why?
We make the following arguments numerically and fundamentally to support the feasibility of such an outcome. We begin with a look at trends in productivity growth going back about 75 years in Figure 2.
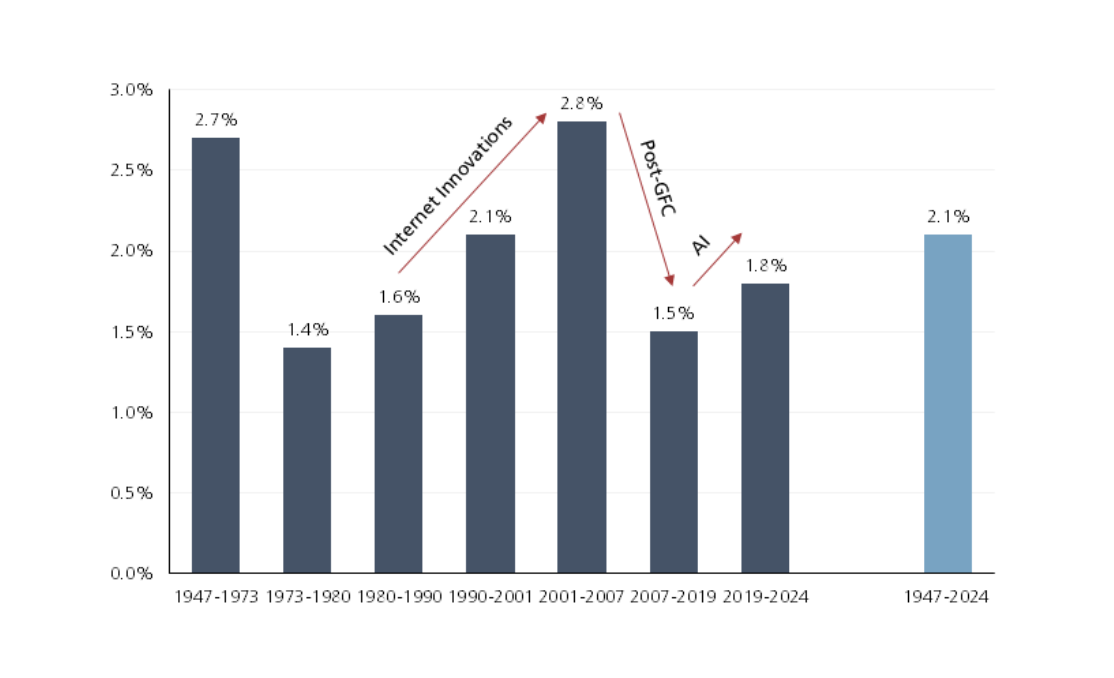
Figure 2: Productivity Changes in the Non-Farm Business Sector
Source: U.S. Bureau of Labor Statistics; as of December 2024
The light blue bar in Figure 2 shows the average annual productivity growth rate in the last 75 years is 2.1%. However, productivity growth does fluctuate a lot around this long-term average. As a rule of thumb, it declines during recessions and periods of slow growth (1970s and the Global Financial Crisis – GFC) and rises during periods of growth and innovation (1980s and 1990s).
We can also see that big swings in productivity growth rates of +/-1% are feasible. Productivity growth rose by more than 1% during the era of Internet Innovations and fell by more than 1% post-GFC.
We believe the new post-Covid economic cycle will foster both innovation and growth for a number of reasons. Technology was deployed at a rapid pace during the pandemic with a positive impact on business operations e.g. hybrid work arrangements, automation and robotics.
Recent advances in AI have also set the stage for significant productivity gains in the coming years. Investments in AI so far have focused on the “infrastructure” phase to facilitate training, learning and inference. We are now moving into the “application” phase where AI systems and agents will monetize this infrastructure to create practical solutions and economic value across the enterprise.
Finally, stimulative deregulation policies from the new administration will also streamline business processes and unlock operational efficiencies. The trifecta of technology, AI and deregulation can easily unlock an increase in productivity growth of approximately 1%.
Our forecast for the real interest rate over the next 10 years is 2.25%, in line with our real GDP growth estimate.
We now have forecasts for both inflation expectations and the real interest rate. Coincidentally, they are both around 2.25%. Our fair estimate for the 10-year Treasury yield is simply the sum of these two components.
We expect the 10-year Treasury yield will settle in the 4.5-4.6% range by the end of 2025. We don’t expect it to go much higher than the 4.8% level of January 10; it will instead recede by a small margin.
We are clear that an increase in real rates is a bigger factor in driving interest rates higher than a change in inflation expectations. We do not believe that inflation is headed higher; it will instead move lower in a bumpy manner. Based on our inflation outlook, the Fed will have more room to cut rates in 2025.
Higher real rates signal a stronger, healthier economy. Stronger economic growth bodes well for corporate profits. We believe that our inflation forecast of 2.25% and 10-year Treasury yield forecast of 4.5% will still be supportive of stock prices.
We close out our analysis and outlook for 2025 with a look at stock market fundamentals.
Stock Market Valuations
U.S. stocks have performed well in the last two years. While their returns have been naturally rewarding, those same high returns have also created risks going into 2025.
On the heels of two consecutive years of at least 25% total returns, U.S. stocks now appear expensive. Many valuation metrics are in the highest quintile of their historical ranges. We take a closer look at a couple of these valuation measures.
At the outset, we acknowledge the topic is complicated and nuanced. Our research is always deep, thorough and rigorous. However, our insights here are curtailed by the finite scope of this article.
We are mindful that the four most dangerous words in investing are widely believed to be “this time is different.” And yet, we also know that a number of time-tested paradigms haven’t worked in the post-pandemic economy and markets. The absence of a recession so far on the heels of an inverted yield curve even after a long lag of two years is a case in point.
We do our best to straddle this balance between respecting historical norms and yet thinking creatively and fundamentally about what might indeed be different this time around.
A commonly used valuation indicator was originally identified by Warren Buffett in a 2001 Fortune magazine essay. The Buffett Indicator measures the market value of all publicly traded U.S. stocks as a percentage of U.S. GDP. When the metric is high, stocks are vulnerable to a sell-off.
The Buffett Indicator has attracted significant attention in recent weeks as it went surging past a level of 200%. In other words, the market capitalization of all U.S. stocks is now more than double the level of total U.S. GDP. The Buffett Indicator suggests that U.S. stocks are now significantly over-valued.
We respect the broad message here that U.S. stocks are not cheap. However, we believe that a couple of relevant insights provide a more balanced perspective on this valuation metric.
The Buffett Indicator is anchored only toU.S. GDP in its denominator. However, many U.S. companies compete effectively in foreign markets. Since a growing number of U.S. companies are multi-national, a material and increasing portion of S&P 500 earnings is generated overseas. Clearly, the market value of all U.S. stocks in the numerator is not bounded by just the size of the U.S. economy. This mismatch causes the Buffett Indicator to rise steadily over time.
We look at another fundamental difference over time that may more rationally explain the trend in the Buffett Indicator.
We know stock prices follow corporate profits; as go profits, so do stock prices. Much like the construct of the Buffett Indicator, we track U.S. corporate profits as a percentage of GDP in Figure 3.
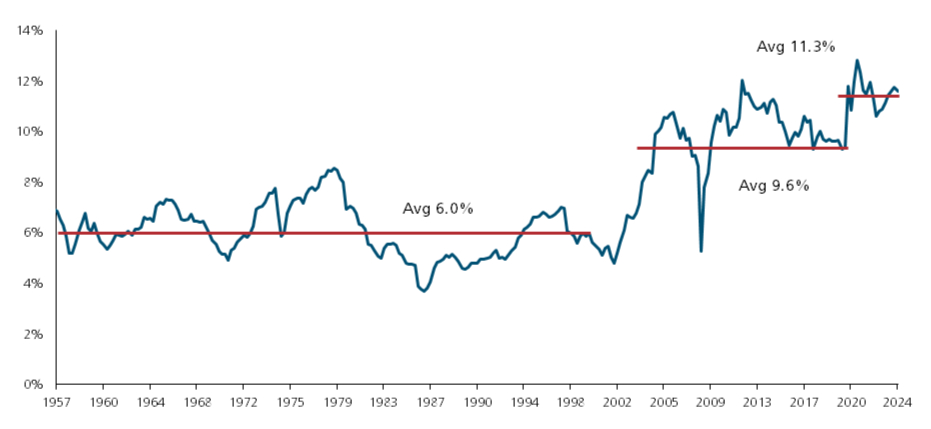
Figure 3: U.S. Corporate Profits as a Percent of GDP
Source: U.S. Bureau of Economic Analysis; as of Q3 2024
U.S. companies have continued to become more and more profitable. Almost analogous to the doubling of the market value of all U.S. stocks as a percent of GDP, U.S. corporate profits as a percent of GDP have also nearly doubled from 6.0% to 11.3%.
We believe these fundamental connections between the growth of U.S. corporate profits and the rise in U.S. stock values help us better understand and interpret the Buffett Indicator.
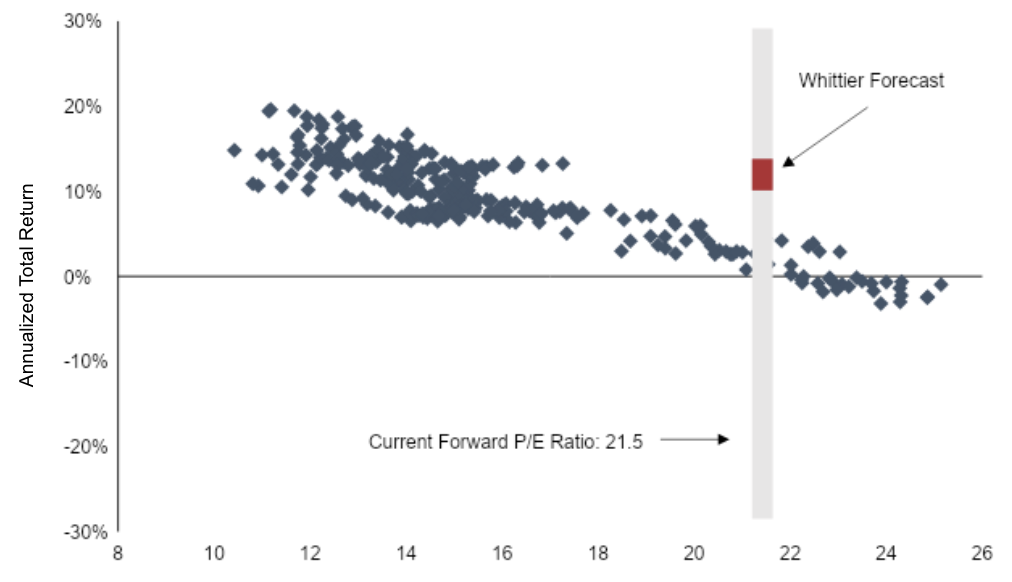
In a similar vein, the Forward P/E (“FPE”) multiple has attracted a lot of attention in recent months. At 21.5 as of December 2024, it is also in the highest quintile of its historical range.
There are two concerns related to the FPE ratio. One, it relies on future earnings (“E”) that were already deemed lofty before the rise in interest rates. And two, even if E comes through as expected, the FPE ratio itself is at risk of compressing through a decline in prices (“P”). We address each of these risks separately.
We have already made our case for a higher gear of growth in the preceding sections. The sustainable spurt higher in real GDP growth from a revival of productivity growth should also spill over into earnings growth.
Consensus analyst forecasts call for an earnings growth rate of 14.8% in 2025 and 13.5% in 2026. We believe these growth rates can be achieved; there is still room for profit margins to expand and augment higher economic, productivity and revenue growth.
We are in general agreement with the market that the P/E ratio will decline in the coming months. We also know that higher starting valuations lead to lower future returns. We are clear that stock returns going forward will be more muted than those seen in recent years.
However, we disagree with the market on both the likely magnitude and speed of decline in the P/E ratio. Investors worry that the 2024 FPE multiple of 21.5 could slide all the way down to its long-term average of around 16. They also fear that the resulting bear market could unfold quickly over just a few months.
We believe that the compression of the FPE multiple will be neither so drastic nor so abrupt. U.S. companies are now more profitable than they have ever been; aggregate free cash flow margins exceed 10% and return on equity is almost 20%.
On the heels of secular innovation, growth and profitability, we believe the fair value of the S&P 500 FPE multiple is now higher at 18-19. We also believe that any decline in the FPE from 21.5 to 18-19 will be more gradual. We expect positive earnings growth to offset the more orderly compression of the FPE multiple.
We illustrate the difference in our stock market forecast and the market consensus in Figure 4.
Source: Bloomberg; from 1988 onwards; as of December 2024
Figure 4 shows the historical association between the FPE ratio and subsequent 10-year returns from 1988 onwards. A quick visual inspection validates our intuition. Higher initial valuations do lead to lower future returns.
The historical data is heavily influenced by two mega crises that took place just a few years apart – the Bursting of the Internet Bubble (BIB) in 2000-2002 and the GFC in 2007 2009. In each instance, earnings declined significantly as did stock prices and valuations.
The empirical relationship in Figure 4 suggests that the current FPE ratio of 21.5 (shown by the grey vertical bar) may lead to stock returns as meager as 2-3% annualized over the next 10 years. A key assumption in this projection is that both earnings (E) and valuations (FPE) will fall as dramatically as they did in the BIB and the GFC.
Our fundamental analysis does not reveal significant downside in E or the FPE multiple. Our earnings outlook identifies more positive fundamentals (e.g. growth in profit margins and productivity) than negative ones (e.g. excessive leverage). We also believe that the fair value of the S&P 500 FPE ratio is now fundamentally higher than it was in prior decades.
We, therefore, expect a higher stock market return over the next 10 years in the range of 8-10% shown by the red bar in Figure 4. We believe that earnings growth of 8-10% and a dividend yield of 1-2% will offset valuation declines of 1-2% annually in the coming decade.
Our stock market outlook for 2025 is also optimistic. We believe expected earnings growth and the dividend yield will create a tailwind of almost 15%. Since interest rates have moved sharply in recent months, we realize the valuation compression in the near term may be as large as -5%. We aggregate these drivers to forecast a 10% total return for the S&P 500. We expect the S&P 500 to reach a level of 6,400 by the end of 2025.
We conclude with a summary of our outlook for the economy, inflation, interest rates and the stock market.
Summary
The economic and market outlook is becoming less dispersed and more homogenous across investors. As an example, there are virtually no proponents of a recession today. It is harder to offer too many differentiated views against such a backdrop.
We summarize the key tenets of our outlook here.
Economy
We expect real GDP growth of 2.5% or above in the next 2-3 years in a significantly pro-growth regime.
Real GDP growth will normalize at a level of around 2.25% over the next 10 years.
We see a clear shift in the drivers and gears of economic growth. The impetus for higher growth in this cycle will come from deregulation, fiscal stimulus and an increase in productivity growth of 0.5-1.0%.
Inflation
We do not see an inflection in inflation up to higher levels.
Inflation should subside in a bumpy path to the 2.3-2.4% level by the end of 2025.
We believe the fair value for inflation expectations over the next 10 years is 2.25%.
We believe the market is mispricing a higher level of future inflation.
The impact of tariffs and immigration will be more muted.
Meaningful base effects will pull inflation lower in the second half of 2025.
Technology will continue to be a powerful secular disinflationary force.
Interest Rates
We estimate the real interest rate to be around 2.25% over the next 10 years.
We believe the fair value for the 10-year Treasury yield is 4.5-4.6%.
The bond market is overestimating the risk premium related to a perceived increase in fiscal risks.
Interest rates are likely to come down from their 4.8% level.
Based on our inflation outlook, the Fed will have more room to cut rates. We expect 3-4 rate cuts by the Fed in 2025.
A Fed policy misstep in the form of rate hikes or bond yields above 5% as a result of overzealous bond vigilantes could trigger a financial accident and curtail growth.
Stock Market
We believe that earnings growth and valuation fears in the stock market are overblown.
As a result, our expected returns for stocks are higher than consensus over both the 1-year and 10-year horizons.
We expect valuations to come down but not as dramatically or quickly as investors fear.
We believe earnings growth will match or exceed expectations in the near term.
We expect the S&P 500 to reach 6,400 by the end of 2025 and generate a 10% total return.
Earnings growth and dividend yield will create a nearly 15% tailwind for stocks in 2025.
Multiple compression of around -5% will detract from stock returns in 2025.
We expect U.S. stocks will generate annual returns of 8-10% over the next 10 years.
We reject the view that a severe valuation overhang will limit annual U.S. stock returns to 2-3% over the next 10 years.
We respect the difficulty of forecasting during normal times, and especially so in the midst of uncertainty. We will assimilate these views into our investment decisions with appropriate caution and adequate risk control.
We believe that 2025 will finally see a normalization of the U.S. economy after the recent pandemic and inflation shocks. We look forward to the prospects of investing in more normal markets.
To learn more about our views on the market or to speak with an advisor about our services, visit our Contact Page.
Whittier Trust, the oldest multi-family office headquartered on the West Coast, celebrates two major milestones in 2025: 60 years of service to the Pacific Northwest and the 25th anniversary of our Seattle office. Our legacy in the Pacific Northwest began in the 1960s with founder Paul Whittier's vision and passion for the region. With a rich history and an enduring commitment to clients, Whittier Trust has been a trusted partner to generations of families and local community organizations throughout Puget Sound.
“As we celebrate six decades in the Pacific Northwest and 25 years since opening our Seattle office, we are immensely proud of our rich history and enduring commitment to our clients and the region’s future,” says David Dahl, President and CEO of Whittier Trust. “We look forward to upholding our dedication to excellence and delivering tailored wealth management, family office and trust services for generations to come.”
The Whittiers were visionaries who recognized the potential of the Pacific Northwest. Their passion for the region’s natural beauty initially led them to Goudge Island in British Columbia, which they purchased in 1949, and then to the San Juan Islands, where they dedicated themselves to philanthropic endeavors.
Today, Whittier Trust’s support of local organizations—including the Friday Harbor Airport, Seattle’s Museum of Flight, San Juan Airlines, Shuttle Express and the San Juan Community Theater—continues to leave a lasting impact on the community. The Whittier Trust team remains actively engaged in supporting these vital entities.
“Paul Whittier’s vision to expand our family office, wealth management and trust services to multi-generational families in the Puget Sound region—anchored by the values of duty, loyalty and commitment—continues to inspire us as we build on our strong foundation,” says Nickolaus Momyer, Northwest Regional Manager, Senior Vice President and Senior Portfolio Manager at Whittier Trust. “We are proud to honor the Whittier Family’s legacy by delivering innovative solutions and personalized service to our clients.”
To view a timeline commemorating the Whittier family’s legacy and Whittier Trust’s impact throughout the region, click here.
Beyond its impact in the Pacific Northwest, Whittier Trust is globally recognized by the Society of Trust and Estate Practitioners (STEP) as one of the top five multi-family offices in the world. The company has also been named one of Washington’s 100 Best Workplaces by the Puget Sound Business Journal, underscoring the company’s dedication to cultivating a positive, productive work environment that empowers its team to exceed client expectations.
Throughout this year, Whittier Trust will host several events and programs to deepen relationships with clients, their families and the local community. Follow Whittier Trust on LinkedIn to learn more about these initiatives and how the company plans to honor this commemorative year.
_____________
For more information about Whittier Trust's wealth management, estate planning and family office services, start a conversation with a Whittier Trust advisor today by visiting ourcontact page.
From Investments to Family Office to Trustee Services and more, we are your single-source solution.

 is pleased to announce the addition of Ted Fogliani as Vice President of Business Development in the firm’s San Diego office. A veteran entrepreneur and former CEO with over 25 years of experience building successful companies in eCommerce, SaaS, manufacturing, and logistics, Ted brings a dynamic mix of strategic vision, operational leadership, and a deep-rooted commitment to client service.


 Whittier Trust is pleased to announce the promotions of